1

Solanum esculentum ameliorates paraquat-induced Cerebellar and Cervical spinal lesions in Wistar Rats.

Sadeeq AA, Amos A, Bauchi ZM, Tanko M and AI Mukthar

Department of Human Anatomy, Neuroscience Unit, Faculty of Basic Medical Sciences, Ahmadu Bello University, Zaria. Nigeria.

Muhammad Z

Department of Human Anatomy, Faculty of Basic Medical sciences, Damaturu, Yobe state University. Nigeria.

El-ladan IS

Department of Human Anatomy, Faculty of Basic Medical Sciences, Umaru Musa Yar’addua University, Katsina, Nigeria.

El-ladan IS

Department of Forensic Sciences, School of Basic and Applied Sciences, Golgotia University, Uttar Pradesh, India

Rilwan BH

Department of Human Anatomy, Faculty of Basic Medical Sciences, Kaduna State University, Kaduna, Nigeria.

All Correspondences to: SadeeqAA, Neuroscience unit, Department of Human Anatomy, Faculty of Basic Medical Sciences, College of Medical Sciences, Ahmadu Bello University, Zaria. e-mail:aasadeequ@gmail.com

ABSTRACT

The herbicide Paraquat, is a superoxide generator that harm neurons, chunk motor axon conduction,and impair locomotive activities.This study evaluates the ameliorative effects of ethanolic extract of tomato (Solanum esculentum) on Paraquat-induced cerebellar cortex and cervical spinal nerve segment lesion of adult Wistar rats. Twenty (20) apparently healthy rats averagely weighing 144g were divided into five groups of four animals each. Group I (control) received normal saline. GroupsII, III and IV were administered 30mg/kg of Paraquat,were administered 30mg/kg of Paraquat followed by tomato extract (1500mg/kg and750mg/kg respectively). Groups Vwere treated with 1500mg/kg tomato extract only. Treatments was via oral route and lasted for twelve consecutive days. Gripstrength and Footprint test for motor coordination and balance were the neurobehavioral studies carried out to ascertain effects on motor coordination.Cervical spinal nerves segment and cerebellar tissue were accessed by opening the hollow vertebral column and sutures of the skull respectively. Tissues were fixed in Bouins fluid, processed using routine Histological stain H and E.Cyto-morphometric evaluation for cell volume and number using a digimizer v4.0 was carried out. Graphad prism v8.0.1 was used for the analysis. Treatment with Paraquat dichloride impaired motor activities of the forelimbs and balance coordination with significant decrease in time taken to release the grip wire (0.01) with an increase in numbers of foot slip that was significant(0.01).Histopathological changes such as nuclei fragmentation or loss and vacoulation were observed in the cerebellum and cervical spinal segment of the spinal cord. However, administration of tomato extract revealed a neuroprotective potential to the spinal cord by improvement in the footprint distance relative to the control;histopathological lesionswere ameliorated in the treated group whencompared with the control.

Keywords:Paraquat, solanum esculentum, Cerebellum, cervical Spinal segment,foot print, motor coordination and balance.

INTRODUCTION

Paraquat is a wild acting, non-selective bipyridylium herbicide extensively used in numerous countries in the world due to the stumpy cost and efficacy against a range of weeds (Costa et al., 2014). It is a quaternary nitrogen herbicide with chemical name 1,1′- dimethyl 4,4′-bipyridinium (Raghu etal., 2013). Which is extremelylethal to both humans and animals by all routes of exposure, and is labelled with a Danger-Poison signal word.Paraquat has been used for withering of seed crops, weed control in orchard; defoliation and desiccation of cotton; as harvest aid in soya bean, sugar cane and for killing dormant plants (Ecobichon, 1991; Raghu et al., 2013).

Paraquat through blood stream it reaches all the areas of the body, leading to lung damage, liver and kidney damage (Podpresartet al., 2007). Inhalation of this herbicide can lead to sore nose and throat and nose bleeding (Baharuddinet al., 2011). Dermal contact can lead to mild irritation, ulceration, blisters, desquamation (loosing of outer skin layer), necrosis and second degree burns (Marrs and Adjei, 2003). Contact with the eye can lead to eye irritation, inflamed eyelids and decreased visual acuity (Wineket al., 2001).Paraquat was revealed to have cause drop in neurotransmitters (Qamar at al., 2013), dead of both matured and immature cerebellar granule neaurons (Stelmashooket al., 2007), caused cerebral hemmorrage (Saeed et al., 2001). Chronic exposure to paraquat is also a potential etiological factor for development of parkinson’s disease (Abdulwahid and Ahmad 2010). A single large dose administered orally or by injection to animals, can cause excitability and lung cramming, which in some cases leads to convulsions, incoordination, and death by respiratory failure. Many cases of illness and/or death have been recorded.Paraquat is not naturally occurring, it is synthesized. Most poisoning is reported to be human deliberate action for suicidal purpose (Dinis-oliveriaet al., 2008).The herbicide paraquat, is a superoxide generator (Liu et al., 1995). These oxidants destroy neurons, block motor axon conduction, and impair open field locomotion, hind limb function, and inclined plane stability when generated in lumbar spinal cord gray matter (Bao and Liu 2002; Liu 1994;Carolina et al., 2019)

Tomato contains valued phytochemicals and antioxidants including carotenoids such as lycopene and beta-carotene (Canene-Adams et al., 2005). It has health effects which include lowering of cholesterol (Palozza and Catalano 2012), anti-inflammatory and antioxidative effect, causes a decrease in risk of blood clotting (Risoet al., 2006), decreases cancer prevalence (Ford et al., 2011), guard against sun burn and promote vision.

Paraquat is a toxic herbicide widely used in developing countries which causes various neurological disorders to both animals and human beings. People are exposed to the potential risk of herbicide and agricultural pesticide via ingestion of food contaminated by Paraquat or accidental exposure.This study determined the evaluating the ameliorative effect of ethanolic extract of tomato on the cerebellum and spinal cord changes induced by paraquat dichloride.

MATERIALS AND METHODS

Experimental Design

Twenty adult male Wistar rats were obtained from the Faculty of Pharmaceutical Sciences, Ahmadu Bello University, with average weight of 144g. The animals were housed in wooden cages with wire gauze covering to allow free ventilation with sow-dust bedding for comfort. They were allowed to acclimatize for three (3) weeks in the animal house of the Department of Human Anatomy, Ahmadu Bello University, Nigeria. Animals were fed daily with vital feed and clean water was provided ad libithum. Animals were randomly divided into five (5) groups of four (4) animals per group.

Animal Handling and Usage

Animals used for the study was according to Ahmadu Bello University, Nigeria, Committee on Animal Use and Care (ABUCAUC)

Chemical Substance

Paraquat dichloride containing herbicide slasher was manufactured by Sinochem Ningbo Ltd, with a batch number 2017101001. The LD50 was adopted from the manufacturer as 100mg/kg. While tomato ethanoic extract LD50was adopted as 500mg/kg according to Wathita et al., (2013)

Administration of Paraquat

Animals were divided into five groups of four animals per group (Group I,II, III,IV and V). Group I (control) received normal saline. Groups II, III and IV were administered 30mg/kg of Paraquat, were administered 30mg/kg of Paraquat followed by tomato extract (1500mg/kg and750mg/kg respectively). Groups V were treated with 1500mg/kg tomato extract only. Treatments was via oral route and lasted for twelve consecutive days.

NEUROBEHAVIORAL STUDIES

Grip strength test

These tests involve the forepaws of the rats being placed on a horizontally suspended metal wire (measuring 2 mm in diameter and 1 m in length), placed one meter above a landing area filled with soft bedding. The length of time each rat was able to stay suspended before falling off the wire is recorded. A maximum time of 2 minutes is given to each rat after which it will be removed. This test reflects muscular strength and balancecoordination in the animals (Tamashiro et al., 2000).

Footprint test for motor coordination and balance Measurement of motor coordination and balance can be used not only to assess the effects of test compounds or other experimental manipulations on mice and rats, but also to characterize the motor phenotype of transgenic or knockout animals (Carter et al., 2001). To obtain footprints, rat paws were painted with nontoxic paints and the mouse is allowed to walk along a narrow, paper- covered corridor, leaving a track of footprints. According to the method established by (Carter et al., 2001), a wooden open-top runway of 100 cm long, 10 cm wide, with walls 20 cm high with an enclosed goal box at one end was set up in the experimental room.The sheet of paper from the runway was removed and the footprint patterns were allowed to dry in a well-aerated room for more than an hour before storing. Each rat was given three consecutive trials on each of three consecutive days of training. For each step parameter, three values are measured from the middle portion of each runway trial, excluding footprints made at the beginning and end of the trial where the mice initiate and finish movement, respectively and the mean of each set of three values is used in the analysis.

Animal Sacrifice

Animals were humanely sacrificesa day after the last administration. Which was anesthetized using chloroform.The brain was removed by opening through the sagittal suture of the skull and ndfixedin aBouin’s fluid for proper preservation and tissue processing. The cervical spinal cord segment was accessed via the vertebral columnby cutting off the entire vertebrae cervical region which was done after fixingin Bouin’s fluid for proper fixation and easy access to the cervical spinal segment (Sadeeq et al., 2017).

Tissue Processing

Brain tissue (cerebellum) and cervical segment of the spinal cord were processed routinely for histopathological studies using Haematoxylin and Eosin staining procedure. Tissue sections were viewed under light microscope and photomicrographs were taken using digital Amscope (MD-900) microscope camera.

Cytometric Analysis

Cell volume is the amount of space the cell occupies and is found by multiplying the length of the cell by the width and the height of the cell..H&E staining technique was used in order to stain the nucleus of the neural cells purple , cell number was counted when nucleus when it is focused in the optical dissector. Digimizer v 4.0 @ medcalc Software was used for calculating the volume and counting cells.

Statistical Analysis

Data obtained was expressed as Mean Standard Error of

100

?

???

80

60

time(s)

40

20

Mean (SEM)One-way analysis of variance(ANOVA) was used to compared the differences between and within the groups A P- Value less than 0.05 was considered to be statistically significant.

RESULTS

The fore grip strength test in figure 1, indicates a significant (p≤0.001) decrease in time taken to release the grip wire among groups treated with Paraquatalone

(30mgkg) when compared to the control and the extract group (1500mgkg).An increase that was significant (p≤ 0.05) in time taken holding on the wire was observed

among groups treated with Paraquat and 1500mg/kg extract of tomato when compared to the groups that received Paraquat/750mg/kg extract and Paraquat (30mg/kg) alone.

Control

Paraquat + 1500mg/kg extract 30mg/kg (Paraquat)

Paraquat + 750mg/kg extract

1500mg/kg extract

0 Groups

Figure 1: mean time taken for animals to release grip wire during fore grip strength test

Table 1. Distance of the forelimb limb strides and base among experimental animals

Mean ± SEM (s)
Day(s) Parameters (cm) Control 30mg/kg 30mg/kg + Paraquat 1500mg/kg Extract 30mg/kg + 750mg/kg Extract 1500mg/kg Extract
7th RFLS 11.58±0.74 11.40±1.81 7.13±3.59 13.07±0.09 11.14±3.59
LFLS 11.48±0.66 11.12±1.33 7.17±3.60 13.01±0.09 12.55±0.38
FB 2.78±0.76 2.53±0.09 1.37±0.68 2.57±0.67 2.45±0.18
12th RFLS 12.20±0.76 11.80±0.55 11.43±0.48** 13.03±0.41** 4.00±0.29
LFLS 11.88±0.92 12.23±0.62 11.20±0.25** 12.63±0.54** 13.80±0.56
FB 2.88±0.14 1.83±0.60 2.53±0.09 2.93±0.35 2.18±0.35

One-way ANOVA, **= p ≤ 0.01. RFLS= Right Forelimb Stride; LFLS= Left Forelimb Stride; FB= Forelimb Base,s(time in seconds)

Histological Observation
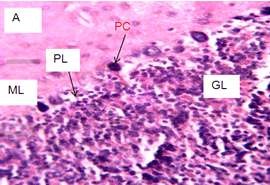
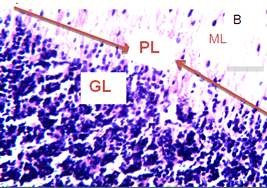
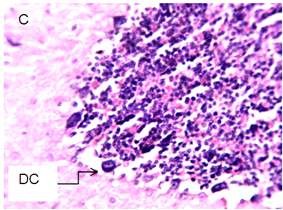
A section of Wistar rat cerebellum of the control group treated with normal saline. Showing normal histoarchitecture of the cerebellar tissue; Molecular layer (ML), Purkinje layer (PL), Purkinje cell (PC) and Granular layer ,(GL). loss purkinje cells (PCS), Degenerating cells (DC), Clumped cells (CC), Disintegrated nuclei (DN) H and E stain (Mag ×250).

A cross section of the cervical spinal segment of the spinal cord anterior horn cell with normal cytoarchitecture cell body (CB), Nucleolus (NC). Nuclei, and congested nuclei (CN). normal cells (NC),loss of nuclei(LN) , loss of neuronal fibres (LF), disintegration nuclei (DN), compacted cells (CC) nerve fibre (NF) and nuclei intact (NI). H&Ex250.

Mean cell volume

Purkinje cells in the cerebellum indicates a significant decrease(p≤0.05) in the mean cellular volume among group treated with Paraquat alone(30mg/kg) when compared with the control and other treated groups An increase in cell volume was also observed among Groups administered 30mg/kg Paraquat/1500mg/kg extract and 30mg/kg Paraquat/750mg/kg extract but not significant when compared to the control and extract group Though, a significant increase (p≤0.01) of cellular volume was noticed in extract treated group (1500mgkg) when compared with all experimental groups and control. Motor

neuron cells in the cervical spinal segment revealed that there was significant increases in cellular volume among group treated with extract alone (1500mg/kg) when compared to the control group and all experimental groups. While group administered with Paraquat alone (30mg/kg) decrease significantly (p≤0.05)when compared with control and

Paraquat/extract combine groups, shows in figure 2b.

Cell count

Figure 2: Mean cellular volume of the Purkinje cells in the cerebellar cortex and Motor neurons in cervical spinal segment (CSS)

Purkinje cells counted in the cerebellum increases significant (p≤0.01) among group treated with tomato extract alone (1500mg/kg) when compared with the control and other treated groups. While an increase (p≤0.05) in cells number was observed among Groups administered

30mg/kg Paraquat/1500mg/kg extract when compared to the control and 30mg/kg Paraquat/750mg/kg extract group, Though, a significant decrease (p≤0.01) of cellular number

was noticed in group treated 30mg/kg of paraquat when

compared with all experimental groups and control as shown in figure 3 Motor neuron cells in the cervical spinal segment revealed that there was a significant increase in cellular number among group treated with extract alone (1500mg/kg) when compared to the control group and all experimental groups. While group administered with Paraquat alone (30mg/kg) decrease significantly (p≤0.05)

when compared with control and Paraquat/extract combine

groups.

Figure 3: Mean cellular number of the Purkinje cells in the cerebellar cortex and Motor neurons in cervical spinal segment (CSS)

DISCUSSION

An increase in forelimb grip mean time was observed among control groups compared to the seventh day which is possibly due to acclimatization to training, a significant increase was also observed among group 30mg/kg + 1500mg/kg Extract animals who were treated with 30mg/kg Paraquat followed by 1500mg/kg tomato extract in day twelve compared to day seven which is possibly due to the ameliorative potential of tomato against neurotoxins which is similar to the finding of Owoeye and Farombi (2015), who reported that treatment of rats with Tomato extract ameliorated the effect of Mercury chloride on cerebellum and increased forelimb strength and movement. In the footprint test, right forelimb stride, left forelimb stride and forelimb base were used to characterize the level of spinal cord damage in the cervical spinal segment of animal rats model used in this study. A decrease in the distance between the left and right forelimb stride was seen in the group that received paraquat alone this may be due to motor impairment elicited by paraquat as described by Liu et al., (1995). An increase in the distance of the left and right forelimb stride in the group that received the fruit extract, this may be due to the cyto-protection elicited by flavonoids which are present in tomato, this is necessary for the maintenance of proper nerve connections as shown by O’Neill et al., (2001).

It was observed that the group treated with 30mg/kg of paraquat had a loss of purkinje cells which could be as a result of paraquat induced cell degeneration. Jayasinghe and Seneviratne (2016) reported degenerative changes in Purkinje cells and granular cells of the cerebellum as a result of paraquat ingestion. This can in turn lead to loss of motor coordination and balance Songin et al., (2010) reported significantly reduced or disturbed motor activity among rats treated with paraquat. The group treated with 30mg/kg of paraquat followed ethanolic extract of tomato showed some viable cells (purkinje cells) with intact nuclei and a few areas of degenerating cells.. These depicts the protective effect of tomato against induced apoptosis or neurodegeneration this is in line with the work of Kokturk et al., (2013) which reported that tomato extract exerted a protective effect against electromagnetic field-induced apoptosis and neurodegeneration in rat Purkinje neurons and granule cells, during pre-and postnatal periods.

The effect of the tomato extract was seen to be dose dependent as the protective effect was more in the group administered high dose of tomato extract than that lower dose.

Histopathological distortion of the cervical spinal segment of the spinal cord section in the group treated with Paraquat alone manifested as neurodegenerative changes such as degenerating cell, disintegrating nuclei, congested nuclei, loss of neuronal fibres and perineuronal vaculations when compared with the spinal section of the control are indication of paraquat induced spinal cord lesions this is in line with the findings of Ren et al., 2009 who reported that repeated doses of Paraquat (10 mg/kg gavage daily for four months or 10 mg/kg intraperitoneal injection twice weekly for three consecutive weeks) induced damage to the cells in substantia nigra pars compacta (SN) in mid brain sections from mice. Chen et al.(2010a , 2010b) who also demonstrated that after treatment with paraquat which was given orally once daily for 28 consecutive days to mice, cells in the hippocampus were irregular, and cytoplasm was found to be condensed. Number of Nissl bodies found there was reduced and apoptotic or necrotic neurons were observed. Increased response latency was also noted in animals given paraquat. A significant decrease in cerebellar cell volume among animals that received 30mg/kg of Paraquat, and a non significant decrease in cell volume among of animals that received 30mg/kg of Paraquat followed by 1500mg/kg of tomato extract and 1500mg/kg of tomato extract decreased when compared to the control group. A significant decrease in cell number of animals in group II,III and IV and an insignificant increase in the number of cells among animals of group v when compared with the control group was observed.

A decrease in the cell number could be as a result of induced apoptosis by Paraquat. Though a cell could be present with intact nucleus, decrease in cell volume may depict impairment in the normal cellular activity such as Energy metabolism, Enzyme and substrate concentration, protein synthesis, cell division which in turn could affect the normal function of a tissue or an organ. The significant decrease in cell number and volume is possibly due to the action of Paraquat, this finding is similar to that of Lou et al., (2012) who reported a significant decrease of viability and significant increase of apoptosis in dopermegic neurons as a

result of oxidative damage and also the work of Chen et al., (2010a) which showed that after treatment with Paraquat for 28 days, cells in the Hippocampus were irregular and cytoplasm was found to be condensed with number of cells reduced. The increase in cell volume and cell number in some of the groups could be attributed to the ameliorative effect of tomato as a result of Its antioxidative property as also reported by Gonz´ales-Vallinas et al., (2 013) Who reported that Tomato contain carotenoid and its function related to their antioxidant power.It was observed that there was a decrease in cell volume and cell number in the group treated with 30 mg/kg of paraquat when compared to the control which will interrupt proper nerve connections which in turn will affect motor impulse conduction and affect motor action, this is in line with the study of Chen et al., 2010 who observed that number of nissl bodies found there could reduce due apoptotic or necrotic neurons upon administration of paraquat. Increase in cell volume and cell number in the cervical spinal is in concordance with the work of Esposito et al., (2002) who showed that protection of cells in culture against diverse insults (glutamate, AB peptide, and others) by flavonoids has proved to be a useful approach.

CONCLUSION

Paraquat dichloride induces neurotoxicity and damage to the cerebellum and cervical spinal segment of the spinal cord. This is Manifested as neurodegenerative changes such as degenerating cell, disintegrating nuclei, congested nuclei, loss of neuronal fibres and peri-neuronal vaculations which in turn affects motor coordination and balance and histomorphometry of the cerebellum and cervical spinal segment. Tomato has a neuroprotective potential against paraquat induced spinal cord lesion in adult male Wistar rats by maintaining the cytoarchitecture of the cervical spinal segment. This could be consequent on the presence of antioxidant properties and phytochemicals present in tomato.

Conflict Of Interest

The authors hereby declare that, the manuscript has not been submitted for publication anywhere, the authors declare also that there is no conflict of interest in the present study.

REFERENCES

  1. Abdulwahid AI and Ahmad KH (2010). Environmental toxins and Parkinson’s

disease: putative roles of impaired electron transport chain and oxidative stress, Toxicology Induced Health; 26(2):121-128.

  1. Baharuddin, M RB, Sahid I B, Noora M.A, Sulieman N and Othman, (2011).Pesticide risk accessment; a study on inhalation and deremal exposure to 2, 4-D and paraquat among Malaysian paddy farmers. Journal of Environmental Health, 46:600-607.
  2. Bao F, Liu D. 2002.Peroxynitrite generated in the rat spinal cord induces neuron death and neurological deficits. Neuroscience 115:839- 849
  3. Canene-Adams, K., J.K. Campbell, S. Zaripheh, E.H. Jeffery and J.W. Jr. Erdman, 2005.The tomato as a functional food.J.

Nutrition., 135: 1226-1230.

  1. Carolina Vaccari , Regina El Dib , Huda Gomaa Luciane C Lopes , João Lauro de C a m a rg o (2 0 1 9) . P a r a q u a t a n d Parkinson’s disease: a systematic review and meta-analysis of observational studies. J Toxicol Environ Health B Crit Rev , 22(5-6):172-202.
  2. Carter R.J.A, Jennifer Morton, and Stephen B. D ( 2001 ) .Current Protocols in Neuroscience; 8.12.1-8.12.14. Chen Q, Niu Y, Zhang R, Guo H, Gao Y. (2010). The toxic influence of paraquat on hippocampus of mice: involvement of oxidative stress. Neurotoxicology, (3): 310-6.
  3. Chen Q., Niu Y., Zhang R., Guo H., Gao Y., Li

Y. and Liu R., (2010a). The toxic influence paraquat on hippocampus of mice: involvement of oxidative s t ress. Neurotoxicology 31(3):310-6.

  1. Costa KM, Maciel IS, Kist LW, Campos MM, Bogo MR (2014) Pharmacological Inhibition of CXCR2 Chemokine Receptors Modulates Paraquat-Induced Intoxication in Rats. Pharmaceutical letter of science one 9(8): e105740.doi:10.1371/journal.pone.0105740
  2. Dinis-Oliveira, R.J., Duarte J.A., Sanchez- Navarro A., Remiao F., Bastos M.L. and Carvalho F., (2008). Paraquat poisonings: Mechanisms of lung toxicity, clinical

features and treatment. Critical Review Toxicology, 38: 13-71.

  1. Ecobichon, Donald J. (1991). Toxic Effects of Pesticides in Casarett and Doull’s Toxicology.The Basic Science of Poisons.Fourth Edition.Mary O. Madur, John Doull, and Curtis D. Klaassen editors Pergamon Press, NY.
  2. Esposito K, Nappo F, Marfella R, Giugliano G. ( 2002 ) . Inflammatory cytokine concentration are acutely increased by hypoglycemia in humans: role of oxidative stress. Circulation; 106: 2067-2072.
  3. Ford NA, Elsen AC, Zuniga K, Lindshield BL, Erdman JW. (2011). Jr Lycopene and apo-12′-lycopenal reduce cell proliferation and alter cell cycle progression in human prostate cancer cells. Nutritional Cancer; 63:256–263
  4. Gonz´ales-Vallinas M., Gonz´ales-Catej´on M., Rodr´ıguez-Casado A. and Ram´ırez de Molina A., (2013). Dietary phytochemicals in cancer prevention and therapy: a complementary approach with promising perspectives, Nutrition Reviews, vol. 71, no. 9, pp. 585–599.
  5. Jayasinghe SS. And Sereviratne S A., (2016), Neurotoxic effect of paraquat, Galle Medical Journal, vol 21(2).
  6. Kokturk S., Melda Y., Saadet D. C., Elif G. D. and Cimbiza A., (2013). Effect of Lycopersicones culentum extract on apoptosis in the rat cerebellum, following prenatal and postnatal exposure to an electromagnetic field, Experimental and therapeutic medicine, 6: 52-56.
  7. Liu D, Yang J, Li L, McAdoo DJ. (1995). Paraquat—a superoxide generator kills neurons in the rat spinal cord. Free RadicBiol Med 18:861-867.
  8. Liu D. (1994). An experimental model c o m b i n i n g m i c r o d i a l y s i s w i t h electrophysiology, histology, and neurochemistry for studying excitotoxicity in spinal cord injury: Effect o f NMDA and kainate. Molecular Chemistry on Neuropathology 23:77-92.
  9. Lou D., Chang X., Li W., Zhao Q., Wangb Y. and Zhou Z., (2012). Paraquat affects the homeostasis of dopaminergic system in PC12 cells, Journal of Pesticide Biochemistry and Physiology, 103:81–86.
  10. Marrs, T.C and Adjei A., (2003). Paraquat, Journal ofMedical Plant Research 1:203- 266.
  11. O’Neill M, Hicks C.A, and Ward M.A. (2001). LY393615, a novel neuronal Ca 2+ a n d N a + c h a n n e l b l o c k e r w i t h neuroprotective effects in models of in vitro and in vivo cerebral ischemia. Brain Research, 888: 138- 149.
  12. Owoeye O. and Farombi E.O., (2015). Tomato pomace protects against mercuric chloride-induced neurodegeneration and motor abnormality in adult rat, International Journal of Biological and Chemical Science, 9(3): 1142-1153.
  13. Palozza P, Catalano A (2012). Effect of tomato product on cholesterol metabolism, Ann Nutrition Metabolism 61(2): 126-134.
  14. Podprasart V, Satayavivad J, Reingrojpitals S, Walairat P, Wananukul W., (2007). No direct hepatotoxic potential following a multiple low dose paraquat exposure in rat as related to its bioaccumulation. Toxicolleff: 170: 193-202.
  15. Raghu, K., Mahesh V., Sasidhar P., Reddy, P. R., Venkataramaniah, V and Agrawal A. (2013). Paraquat poisoning: A case report and review of literature journal of Family community Meicine. 20: 198-200.
  16. Ren J.P., Zhao Y.W and Sun X.J (2009). Toxic influence of chronic oral administration of paraquat on nigrostriatal dopaminergic neurons in C57BL/6 mice; (19): 2366-2371. respiratory syncytial virus-F protein induces

a systemic immune response. Transitional Resources; (9): 127-135.

  1. Riso P, Vigioli F, Grande S, Guarnieri S, Gardama C. 2006, Effect of tomato-based drink on markers of inflammation, immunodulation and oxidative stress,

Agricultural food journal: 54(7): 2563-2566.

  1. Songin M, Strosznajder JB, Fitał M, Kuter K, Kolasiewicz W, Nowak P,andOssowska K.( 2010). Glycogen Synthase Kinase 3b and its phosphorylated form (Y216) in the paraquatinduced model of parkinsonism. Neurotoxicity Research
  2. Tamashiro KLK, Wakayama T, Blanchard RJ, Blanchard C and Yanagimachi R. (2000). P o s t n a t a l g r o w t h a n d b e h a v i o r a l development of mice cloned from adult cumulus cells. Biological Reproduction, 63: 328–334. Toxicology.Volume 3.
  3. Wathita P., Supaporn M., Terdthai T., Jintanaporn W., Wipawee T., Chonlathip T., s Bungorn S. and Panakaporn W., (2013).Acute toxicity study of tomato pomase extract in rodents, Online Journal of Biological Science, 13(1):28-34.
  4. Winek, CL, Wahba, WW, Winek, CL Jr., Winek-Balzer, T., (2001).Winek’sdrug and chemical blood level data.


Reducing Vaccination Hesitancy during a Covid-19 Pandemic

Francis Ajeneye

Blood Sciences Department, Maidstone and Tunbridge Well Hospitals NHS Trust, TN2 4QJ, U.K All Correspondences to: Francis Ajeneye, f.ajeneye1@nhs.net

INTRODUCTION

Vaccines save millions of lives each year. Vaccines work by teaching the body’s natural defenses, the immune system to recognize and

The risk of vaccination and the untimely release of Covid had led to fewer public health websites than searches without risk as a search term. There is a significant relationship between organization on social media and public doubts of vaccine safety. In addition,

fight off the viruses and bacteria they target. After vaccination, if the body is later exposed to those corresponding viruses, the body immediately recognize to fight the infection. The killer T-cells destroy the infected cells, while the B-cells and helper T-cells support antibody production. The challenge facing government and public health authorities is designing tailored strategies that successfully reach vaccination skeptics.

Designing a vaccine against the new coronavirus is an enormous challenge for researcher world-wide, but if there are things we learnt from history to reduce the hesitance of vaccination uptake during a pandemic, this must be addressed by the policymakers across the world.

Public acceptance of vaccination programs is essential for unnecessary exposures to diseases. However, increasing sectors of the population across the world have expressed hesitancy about participating in such programs, which might lead to the re-emergence of vaccine preventable diseases.

Policymakers need to begin planning for ways to work against the patterns of hesitancy in vaccine uptake by conducting a qualitative research prior to the release of Vaccination and the insights gathered about your audience will help policyholders to develop evidence- informed communication activities prior to introducing any new vaccines. While public outreach and education about the importance of vaccines will likely be the cornerstone of any vaccine deployment. The use of the internet and social media stations spreads, the challenge of vaccination hesitancy presents itself as an increasingly trans-national problem, a characteristic that further complicates policymakers’ tasks of designing effective policies.

There are many studies in this area are guided by an explicit theory vaccination hesitancy, short- or long- term side-effects or are ineffective, attitude factors, religious belief and the distrust of governments and historical abuse of experiments on vulnerable subjects.

there is a substantial relationship between foreign disinformation campaigns and declining vaccination coverage.

Much of the hesitation to get a Covid-19 vaccine stems from the lack of trust in the health care system, the pharmaceutical companies that brought the vaccines to market within a record time, in some vaccination advocates, and in our government that is regulating and promoting it. In addition to strategies to combat misinformation, we must wage an all-out effort to build public trust. To compensate for this, national and state public health authorities and vaccine administration sites could provide real-world safety data to help people of various ethnicities and conditions see how the vaccine is faring in groups that most closely represent them.

According to the Centers for Disease Control and Prevention (CDC): “Researchers have been working with mRNA vaccines for decades. Interest has grown in these vaccines because they can be developed in a laboratory using readily available materials. This means the progression can be standardized and scaled up, making vaccine development faster than traditional methods of making vaccines.”

The COVID-19 RNA vaccine consists of mRNA molecules made in a laboratory that code for parts of the SARS-CoV-2 virus, specifically the virus’ spike protein. Once injected into the body, the mRNA instructs the cells to produce antigens – such as the spike protein which are then detected by immune cells, triggering a response by the body’s lymphocytes. Whoever is exposed to the COVID-19 coronavirus in the future would have an immune system to fight off the infection.

There are good reasons for an immunization programme to conduct its own qualitative formative research before the introduction any new vaccine. The research provides valuable insights into the target audience’s points of view, concerns, and needs, Attendance to the audience’s concerns benefits the overall immunization programme. By identifying the population’s knowledge gaps and misinformation and highlighting programme deficiencies can help immunization staff modify

Reducing Vaccination Hesitancy…

services accordingly and finally Involving key stakeholders and target group members in the research builds the community’s sense of participation in the work of the programme. The public will have a greater sense of ownership of the vaccination programme when they feel they have been heard.

In many of the studies, a large number of the subjects were poor, vulnerable, racial minorities, and/or prisoners. Often, subjects were sick or disabled people, whose physicians told them that they were receiving “medical treatment”. They were used as the subjects of harmful and deadly experiments, without their knowledge or consent. In response to this, interest groups and institutions across the world have worked to design policies and oversight to ensure that future human subject research in the would be ethical and legal.

Eventually, for certain groups, policymakers may need to employ accessible ways for people to get adapted health information about the vaccine. This is especially important for marginalized populations who have less access to doctors. Possible approaches range from a simple text messaging system, influential community leaders, religious leaders, charity organizations to encourage immunization. Availability in multiple languages will be crucial.

Often the absolute complexity of the health care system prevents people from getting the right care. Once there is interest in getting the vaccine, people need to know when and where to get it. Because the vaccine is being rolled out in waves to different populations,

We should set up vaccination sites to offer easy access, minimize waiting times, and provide more time and attention to those who need it. When it comes to access, convenience is key. Besides, we can leverage the innovation and infrastructure built for Covid-19 testing. For example, drive-through testing sites that allow people to stay in their car could add a vaccination service . Vaccination sites could designate certain time slots for anyone who wants or needs a higher-touch experience, such as children, the elderly, those with physical challenges, and those who fear needles.

The hardest part of the vaccination process is actually the day one to day three after someone has received the shot when a significant proportion of people experience side effects, which range from pain at the injection site to headaches to low-grade fevers. Managing expectations about these side effects is important. If people expect no side effects but feel terrible, they will have a bad experience; conversely, if they feel less discomfort than anticipated, they will have a better experience.

Unfortunately, getting the shot doesn’t mean people can immediately go back to their pre-Immunity to the vaccine takes days to build, a second dose of the vaccine is vital, and we still need to wear masks after getting vaccinated.

Social media can add a function that makes it easy for people to notify the members of their networks that they have scheduled or received the first shot and then the second.

CONCLUSION:

Policymakers need to begin planning now for ways to work against the patterns found in many studies about vaccination hesitancy. While public outreach and education about the importance of vaccines will likely be the cornerstone of any vaccine deployment. More research on the influence of different sources of information is needed to determine the best way to disseminate information to public.

REFERENCES
  1. Michie S, van Stralen MM, West R. (2011). The behaviour change wheel: a new method for characterising and designing behaviour change interventions. Implement Sci. 23;6:42. doi: 10.1186/1748-5908-6-42. PMID: 21513547; PMCID: PMC3096582
  2. Harmsen, I.A., Mollema, L., Ruiter, R.A. et al. Why parents refuse childhood vaccination: a qualitative study using online focus groups. BMC Public H e a l t h 1 3 , 1 1 8 3 ( 2 0 1 3 ) . https://doi.org/10.1186/1471-2458-13-1183.
  3. Kieslich K. (2018). Addressing vaccination hesitancy in Europe: a case study in state-society relations. European journal of public health, 2 8( s u p p l _ 3 ) , 3 0 – 3 3 . https://doi.org/10.1093/eurpub/cky155.
  4. Mesch, G. S., & Schwirian, K. P. (2015). Social and political determinants of vaccine hesitancy: Lessons learned from the H1N1 pandemic of 2009- 2010. American journal of infection control, 43(11), 1 1 6 1 – 1 1 6 5 . h t t p s : / / d o i . o r g / 1 0 . 1 0 1 6/j.ajic.2015.06.031
  1. Eisenstein M.(2014). Public health: An injection of trust. Nature. Mar 6;507(7490):S17-9. doi: 10.1038/507s17a. PMID: 24611174.
  2. S.W. Roush, T.V. Murphy (2007). Vaccine- preventable disease table working G. Historical comparisons of morbidity and mortality for vaccine-preventable diseases in the United States JAMA, 298; pp. 2155-2163.
  3. J.J. Rainey, M. Watkins, T.K. Ryman, P. Sandhu, A. Bo, K. Banerjee (2011). Reasons related to non- vaccination and under-vaccination of children in low and middle income countries: findings from a systematic review of the published literature, 1999–2009 Vaccine, 29; pp. 8215-8221.
  4. R.W. Rogers (1975) Protection motivation theory of fear appeals and attitude-change J Psychol, 91; pp. 93-114.
  5. A. Bish, S. Michie .(2010) Demographic and attitudinal determinants of protective behaviours during a pandemic: a review Br J Health Psychol, 15; pp. 797-824.
  6. E. Mills, A.R. Jadad, C. Ross, K. Wilson (2005). Systematic review of qualitative studies exploring parental beliefs and attitudes toward childhood vaccination identifies common barriers to vaccinationJ Clin Epidemiol, 58; pp. 1081-1088.
  7. Bond L, Nolan T.(2011). Making sense of perceptions of risk of diseases and vaccinations: a qualitative study combining models of health beliefs, decision-making and risk perception. BMC Public Health. 2011 Dec 20;11:943. doi: 10.1186/1471-2458-11-943. PMID: 22182354; PMCID: PMC3260331
  8. K.F. Brown, J.S. Kroll, M.J. Hudson, M. Ramsay, J. Green, S.J. Long, et al. (2010). Factors underlying parental decisions about combination childhood vaccinations including MMR: a systematic review Vaccine, 28; pp. 4235-4248.
  9. D.S. Diekema (2005). Responding to parental refusals of immunization of children Pediatrics, 115; pp. 1428-1431.
  10. M.E. Falagas, E. Zarkadoulia (2008). Factors associated with suboptimal compliance to vaccinations in children in developed countries: a systematic review Curr Med Res Opin, 24; pp. 1719-1741
  11. S.J. Kessels, H.S. Marshall, M. Watson, A.J. Braunack-Mayer, R. Reuzel, R.L. Tooher Factors associated with HPV vaccine uptake in teenage girls: a systematic review Vaccine, 30 (2012), pp. 3546-3556


Evaluation of vitamin B12 levels and Hypersegmented Neutrophils in pregnant women attending Rivers State University Teaching Hospital, Port Harcourt

Ibiere Allwell Pepple, Catherine Omo Osin and Serekara Gideon Christian*

Department of Medical Laboratory Science, Rivers State University, Nkpolu-Oroworukwo, Port Harcourt, Nigeria All Correspondences to: serekara.christian1@ust.edu.ng

ABSTRACT

This study was aimed at evaluating levels of vitamin B12 and the presence of hypersegmented neutrophils in pregnant women attending Rivers State University Teaching Hospital. It is a comparative and case control study designed to evaluate the levels of vitamin B12 and presence of hypersegmented neutrophils in pregnant women. The study comprises of apparently healthy women in three groups of twenty-five females each (pregnant women who have not had miscarriage, pregnant women with previous miscarriage, and control subjects who have never been pregnant), aged between 30 to 35 years. The study was carried out from July through August 2019. Vitamin B12 levels were determined using ELISA method. Thin films were made and stained using Leishman stain to identify presence of hypersegmented neutrophils. Data was analyzed using Graph Pad prism 8.0.2 statistical package; p<0.05 was considered statistically significant. The results showed significant increase of vitamin B12 in women with miscarriages (193.78±110.63μg/day), when compared to that of women without miscarriages (174.80±53.14 μg/day), and that of non- pregnant women (98.03±9.50 μg/day). Hypersegmented neutrophils were found to be high among women with miscarriages (16%) when compared to those without miscarriage (4%), and control (0%). The miscarriages recorded among the women could be as a result of the presence of hypersegmented neutrophil which is indicative of the tendencies towards miscarriages. However, the high significant level of vitamin B12 in pregnant women with miscarriages may be due to their sea food diet despite the presence of hypersegmented neu trophils; which requ ires fu rtherinvestig a tion.

Keywords: Vitamin B12, Hypersegmented Neutrophils, Pregnancy, Miscarriage
INTRODUCTION

Pregnancy is the period from conception to birth. Pregnancy begins with the fertilization of an ovum (egg) and its implantation. The egg develops into the placenta and the embryo grows to form the foetus. Most eggs implant into the uterus upon fertilization by sperm cell. A normal pregnancy last around 40 weeks from the first day of the woman’s last menstrual period. Normal pregnancy consists of three trimesters of 3 months each (1). Miscarriage (biochemical pregnancy loss) is the pregnancy loss, which occurs after a positive urinary or serum human chorionic gonadotropin (hCG), but before ultrasound or histological detection of pregnancy (<6 weeks) (2). It can also be said to be the loss of the fetus before the 24th week of pregnancy or viability (the ability of the fetus to survive outside the uterus without artificial support). Majority of miscarriages occurs in the first trimester and may be mistaken sometimes for a late menstrual flow (1).

Vitamin B12 (cobalamin or cyanocobalamin) is a water- soluble vitamin that plays a vital role in the activities of several enzymes in the body. It is important in the production of red blood cells in the bone marrow and in the utilization of folic acid and carbohydrate in the diet and the functioning of the nervous system (1). Vitamin B12 sources for humans is food of animal origin. The highest amounts are found in liver and kidney (up to 100μg per 100 g), but it is also present in shellfish, organ and muscle meats, fish, chicken and dairy products (eggs, cheese and milk) in small amounts (6μg/L). Vegetables, fruits and all other foods of non-animal origin are free from cobalamin unless they are contaminated by bacteria. Cooking does not usually destroy cobalamin(3). Vitamin B12 maintains normal folate metabolism which is essential for cell multiplication during pregnancy.

Neutrophil hypersegmentation can be defined as the presence of neutrophils whose nuclei have six or more lobes or the presence of more than 3% of neutrophils with at least five nuclear lobes( 5 ). The presence of hypersegmented neutrophils is suggestive of cobalamin or folate deficiency( 6 ) . So pregnant women with hypersegmented neutrophils correlates with the low amount of vitamin B12 which is detrimental to red blood cell formation and a likely predisposition to neural tube defect and also pregnancy loss (miscarriage). The presence of hypersegmented neutrophils in pregnant women is also an indication of megaloblastic anaemia (5), which puts the pregnancy at risk of a miscarriage. According to Tavasoli et al., the presence of hypersegmented neutrophils indicates low levels of vitamin B12 which results in pregnancy loss due hypercoagulable states and bleeding (7).

In Sub-Saharan Africa, Nigeria inclusive, iron and folate deficiencies were reported to be the most common causes of anaemia in pregnant women (8) Lack and/or insufficient levels of iron supplementation was also reported to be among the most significant risk factors for anaemia to occur during pregnancy(9,10). An anaemic pregnant woman by implication of her condition lacks enough red blood cells for normal metabolic activities and that of the foetus. The resultant effect is that the foetus is deprived of adequate supply of the necessary nutrients required for foetal development.

There is paucity of scientific research information on the levels of vitamin B12 and presence of hypersegmented neutrophils in pregnant women in Rivers State, Nigeria, even though so much effort has been made to improve on the amount of vitamin B12 taken by pregnant women during their routine ante-natal clinic visits. This study was therefore undertaken to ascertain if levels of vitamin B12 and hypersegmented neutrophils could cause pregnancy loss or miscarriage in pregnant women. Hence the need to give this claim a scientific backing.

The aim of the study was to estimate the levels of vitamin B12 and the presence of hypersegmented neutrophils in pregnant women attending River State University Teaching Hospital. The specific objectives of the study are: To estimate the levels of vitamin B12 among pregnant women attending River State University Teaching Hospital; To estimate the number of hypersegmented neutrophils in women attending River State University Teaching Hospital; To ascertain the relationship in values of vitamin B12 estimation with the presence of hypersegmented neutrophils in pregnant women and non- pregnant women.

MATERIALS AND METHODS

Study Design

This is a comparative and case control study which is designed to assess and evaluate the levels of vitamin B12 and the presence of hypersegmented neutrophils in pregnant women attending River State University Teaching Hospital. This study was carried out from July through August 2019.

Study Area

This study was carried out in Rivers State University Teaching Hospital. The hospital is located in Port Harcourt, Rivers State, Nigeria. Port Harcourt is located on GPS coordinates of 4° 49′ 27.0012” N and 7° 2′ 0.9996” E. Rivers State University Teaching Hospital formally Braithwaite Memorial Specialist Hospital (BMSH) is a government-owned hospital, which was named after Eldred Curwen Braithwaite, a British doctor and a pioneer of surgery. It is located in Old GRA, Rivers State. It was established in March 1925.

Study Population

The subjects in this study comprised of apparently healthy pregnant women. Blood samples were drawn from seventy-five (75) women into ethylene diamine tetra acetic acid (EDTA) containers. Their age bracket was 30 to 35 years. They comprised of three (3) groups of 25 subjects each: pregnant women who have not had miscarriage(s), pregnant women that have had previous miscarriage(s) and control subjects who are the non – pregnant women. Women who were less than 30 years or more than 35years were excluded from the study. Convenient sampling method was adopted in recruiting participants.

Informed Consent/Ethical Approval

Informed consent was obtained from the pregnant women before their samples were collected upon clearance from the Department of Medical Laboratory Science, Rivers State University.

Eligibility Criteria

Only apparently healthy pregnant women attending Rivers State University Teaching Hospital and apparently healthy non pregnant women were recruited for this study.

Sample Collection and Storage

A total of 3ml of venous blood was collected by venipuncture with the use of vacutainer needle from each subject and added into individualized vacutainer tube containing 0.5ml of 1.2mg/ml dipotassium ethylene tetra- acetic acid (EDTA). The blood samples in EDTA containers were centrifuged to obtain plasma. The plasma obtained was used to analyse for vitamin B12 using an ELISA reader capable of reading absorbance at 450nm. Thin films were also made immediately before the plasma was separated.

Sample Analysis

The parameters that were analysed were vitamin B12 and presence of hypersegmented neutrophils in thin films.

      1. Determination of Vitamin B12 Using Human Vitamin B12 ELISA Kit, CALBIOTECH, Inc., El Cajon,

U.S.A. Lot No VBE5774; Expiry Date: 2020/05

Principle: It makes use of solid phase ELISA methodology based on the principle of delayed competitive binding. Streptavidin coated wells are incubated with extracted vitamin B12 standards, controls, samples and intrinsic Factor-Biotin conjugate at room temperature for 45 minutes. During the incubation, the biotin-labelled intrinsic factor binds to vitamin B12 in the sample, standard or quality control plasma, after the 45-minutes incubation, vitamin B12 enzyme conjugate is added which competes with the vitamin B12 in the sample, standard, or quality control plasma for the remaining sites on the intrinsic factor for an additional 30 minutes. All unbounded conjugates are then removed and the wells are washed, Next, a solution of tetramethylbenzidine (TMB) reagent is added and incubated at room temperature for 15 minutes, resulting in the development of blue colour. The colour development is stopped with the addition of stop solution, and the absorbance is measured spectrophotometrically at 450 nm. The colour intensity is inversely proportional to the amount of vitamin B12 in the sample. The total procedure run time is 1.5 hours.

Procedure: The EDTA blood samples were centrifuged to obtain plasma. All reagents and specimens were allowed to come to room temperature before use. Desired number of coated strips was placed into the holder. 50µl of extracted Vitamin B12 standards, controls and samples was dispensed into appropriate wells. 50 µl of biotinylated intrinsic factor reagent was dispensed into each well. The microplate was shaken gently for 30 seconds to mix. It was incubated for 45 minutes, at room temperature (250oC). 50 µl of enzyme conjugate was added into all the wells. The microplate was gently shaken for 30 seconds to mix. It was incubated for 30 minutes at room temperature (250oC). The contents were briskly shaken out of the wells. The wells were rinsed 3 times with wash buffer. The wells were stroked sharply on absorbent paper to remove residual water droplets. 100 µl of tetramethylbenzidine (TMB) substrate was dispensed into each well which resulted in the development of a blue coloured solution. The absorbance was read spectrophotometrically at 450nm.

Procedure for Thin Blood Film Preparation

One micro litre of blood was dropped near the end of a slide. The edge of the spreader was placed in front of the blood at an angle of 45o. the spreader was drawn back until it touched the drop of blood and the drop spread along the line of contact between the spreader and the slide on which the film was made. The spreader was moved along the slide with a smooth movement. The film was allowed to air dry. The subject identification was written directly on the frosted end using a lead pencil.

Film Staining using Leishman Staining Technique

Principle: Leishman stain is a mixture of eosin and methylene blue. The acidic dye, eosin variably stains the basic components of the cell which is the cytoplasm and the

basic stain, methylene blue stains the acidic components, especially the nucleus.

Procedure

The slide was placed on the staining rack. The film was flooded with Leishman stain and the stain was allowed to stain for 2 minutes. The stain was later diluted with equal volume of buffered water (pH 6.8) and was allowed to stand for 8 minutes. After 8 minutes, the stain and buffered water was washed off and slide allowed to drain. The back of the slide was then cleaned with cotton wool soaked with 70% alcohol. The film was dried on a rack in a vertical position. The stained f i lmed was examined microscopically using oil immersion objective (100x), ( Olympus microscope) for the presence of hypersegmented neutrophils.

Statistical Analysis

The data generated from this study was analysed and calculated to determine the mean, standard deviation, p- value, f-value using analysis of variance; Tukey’s multiple comparison test was done to check for significance in between groups. Graph pad prism 8.0.2 statistical package was used for the analysis.

RESULTS
    1. Demographic Details of Participants

A total of seventy-five (75) females were recruited for this study. Fifty (50) of the females were pregnant women and were grouped into two (25 were pregnant women that had previous miscarriage(s) and the other 25 were pregnant women that have not had miscarriage(s). Twenty-five (25) women served as control subjects and were non-pregnant. Their age range was between 30-35 years and they were all residents of Port Harcourt, Rivers State. Details are shown in Table 1.

Table 1: Demographic Details of Participants

Age (Years)

No. of Pregnant Women with previous Miscarriage

No. of Pregnant Women without Previous Miscarriage

Control Subjects (Non-pregnant without history of Miscarriage)

30-35 25 25 25

Analysis of Variance of Vitamin B12 in Study Population

Table 2 showed the comparison of vitamin B12 level in pregnant women with previous miscarriage(s), pregnant women without previous miscarriage(s) and non-pregnant women (control)-without history of miscarriage.

Comparatively, the analysis showed that there was statistically significant difference (p<0.05) in the values of vitamin B12 of women with miscarriages (193.78±110.63 μg/day), women without miscarriages (174.80±53.14 μg/day) and the control group (98.03±9.50 μg/day).

Table 2: Comparison of vitamin B12 level using analysis of variance in the study population

Parameter PW+M (A) PW-M (B) Control (C) p-value F-value Inference Tukey’s Multiple Mean±SD Mean±SD Mean±SD Comparison Test

Vitamin 193.78±110.63 174.80±53.14 98.03±9.50 <0.0001 11.95 HS A vs B0.4231 B12 A vs C 0.0001

(µmol/day) B vs C 0.0001

Key: PW+M = Pregnant women with previous miscarriage(s); PW-M = Pregnant women without previous miscarriage(s); HS = Highly significant; SD = Standard deviation. (Applicable to all Tables).

    1. Percentage Distribution of Hypersegmented Neutrophils in Percentage Rate in the Study Population Table 3. shows the percentage distribution of hyper- segmented neutrophils in women with miscarriages, without miscarriages and non-pregnant women. The result showed that the percentage rate of hyper-segmented

neutrophils in women with miscarriages was 4(16%) while the percentage rate of hyper-segmented neutrophils in women without miscarriages was 1(4%). No hyper- segmented neutrophils were found in non-pregnant women.

Table 3: Percentage distribution of hyper-segmented neutrophils in women with miscarriages, without miscarriages and Non-pregnant women

Parameter No. of Women with hyper-segmented Neutrophils Percentage (%)

PW+M (N=25) 4 16
PW-M (N=25) 1 4
Control (N=25) 0 0
4.0 DISCUSSION

From this study, it was observed that there was a significant increase (p<0.05) in the values of vitamin B12 in women with previous miscarriages than those without a history of miscarriage and control participants. Non-pregnant (control) in this study recorded low level of vitamin B12 as a result of them not being on drug supplements and also not having huge appetite for food when compared to pregnant women. The level of vitamin B12 in our study subjects were within the range as reported by VanderJagt et al., (11).

Though it has been reported that maternal vitamin B12 deficiency and increased presence of hypersegmented neutrophils have been associated with increased risk of common pregnancy complications, including spontaneous abortion (miscarriage), low birth weight, intrauterine

among the women could be as a result of the presence of hypersegmented neutrophil which is indicative of the tendencies towards miscarriages. However, the high significant level of vitamin B12 in pregnant women with miscarriages may be due to their sea food diet despite the presence of hypersegmented neutrophils; which requires further investigation.

REFERENCES
  1. British Medical Association. Illustrated Medical Dictionary, 2nd edition, London: Dorling Kindersley Ltd, 2008.
  2. Farquharson RG, Jauniaux E, Exalto N; ESHRE Special Interest Group for Early Pregnancy (SIGEP). Updated and revised nomenclaturefor description of growth restriction and neural tube defects (12, 13). The e a r l y p r e g n a n c y e v e n t s . H u m R e p r o d .

findings of the study indicated that pregnant women with history of miscarriages and those without history of miscarriage had high level of vitamin B12; and so, our findings are at variance with the above reports, probably as a result of the management of the conditions that aforetime may have caused the miscarriages.

The presence of hypersegmented neutrophils is an important diagnostic feature of megaloblastic anaemia; and deficiency of vitamin B12 have been associated with megaloblastic anaemia. In regards to the percentage rate of hypersegmented neutrophils in women with history of miscarriage(s), without history of miscarriage and non- pregnant women, the result showed 4(16%) 1(4%) and 0% in the same order. The hypersegmented neutrophils were found to be high amongst women with history of miscarriage(s) (16%), and this indicates that hypersegmented neutrophils could be associated with miscarriages in some cases in women. The presence of hypersegmented neutrophils in pregnant women with history of miscarriage(s) may probably be only a reflection of their previous miscarriage(s) and tendency towards a miscarriage.

5.0 CONCLUSION

The study revealed that women with miscarriages recorded

2 0 0 5 ; 2 0 ( 1 1 ) : 3 0 0 8 – 1 1 . d o i : 1 0 . 1 0 9 3 /

humrep/dei167.[Pub Med].

  1. Hamid, GA. Clinical Haematology. Retrieved from: https;//www.researchgate.net. Accessed: October 10, 2019.
  2. Van Sande H, Jacquemyn Y, Karepouan N, Ajaji M. Vitamin B12 in pregnancy: maternal and fetal/neonatal effects, a review. Open Journal of Obstetrics and Gynecology. 2013;03(07):599-602. DOI: 10.4236/ojog.2013.37107.
  3. Bain JB. Blood cell morphology in health and disease. Retrieved from https://doi.org/10.1016/B978-0-7020- 6696-2.00005-9. Accessed: February 1, 2021.
  4. Thachil J, Bates I. Approach to the diagnosis and classification of blood cell disorders. Retrieved from: http: https://doi.org/10.1016/B978-0-7020-6696- 2.00023-0. Accessed: February 1, 2021.
  5. Tavasoli B, Tabibian S, Majid G, Souri S, Shams M, Rashidpanah J, Firoozkohi F, Shamsizadeh M, Dorgalaleh A. Extensive Hematoma in a Patient with Hereditary Hypersegmentation of Neutrophils. J

high amount of vitamin B12 and high percentage of

Cell Mol Anesth. 2016;1(3):109-14.

hypersegmented neutrophils. The miscarriages recorded 8. Baker SJ, DeMaeyer EM. “Nutritional anemia: It

understanding and control with special reference to the work of the world health organization,” American Journal of Clinical Nutrition, vol. 32, no. 2, pp. 368–417, 1979.

  1. Aikawa R, Khan NC, Sasaki S, Binns CW. “Risk factors for iron-deficiency anaemia among pregnant women living in rural Vietnam,” Public Health Nutrition, vol. 9, no. 4, pp. 443–448, 2006.
  2. Vivek RG, Halappanavar AB, Vivek PR, Halki SB, Maled VS, Deshpande PS. “Prevalence of Anemia and its epidemiological,” Determinants in Pregnant Women, vol. 5, no. 3, pp. 216–223, 2012.
  3. VanderJagt DJ, Brock HS, Melah GS, El-Nafaty AU, Crossey MJ. Glew, RH. (2007). Nutritional factors associated with anaemia in pregnant women in northern Nigeria, Journal of Health, Population and Nutrition. 2007;25(1):75–81.
  4. Gaber KR, Farag MK, Soliman SET, El-Bassyouni HT, El-Kamah G. Maternal vitamin B12 and the risk of fetal neural tube defects in Egyptian patients. Clinical Laboratory. 2007;53(1-2), 69–75.
  5. Molloy AM Kirke PN Troendle JF. et al., Maternal vitamin B12 status and risk of neural tube defects in a population with high neural tube defect prevalence and no folic Acid fortification. Paediatrics. 2009;123(3),917-923.


CITRODORA OIL: A biosafer alternative to xylene as tissue clearing and dewaxing agent

Akpulu S.P and Hamman W.O

Department of Human Anatomy, Faculty of Basic Med. Scin, Ahmadu Bello University Zaria.

Oladele S.B

Department of Vet.Anatomy, Ahmadu Bello University, Zaria.

Ahmed S.A

Department of Pathology, Faculty of Medicine, Ahmadu Bello University, Zaria, Nigeria All Correspondences to: Akpulu S.P E-mail: petosw2000@yahoo.com

ABSTRACT

Since time immemorial, xylene has been one of the most commonly used tissue clearing and dewaxing agent in histology /histopathology laboratories. However, off late, xylene has been reported to have many toxic effects. Numerous solutions have been suggested as possible alternatives to xylene during tissue processing and staining. Most of these suggested alternatives are at best act like xylene. This study compared the efficacy of Citrodora oil, as a possible alternative to xylene in tissue processing and staining procedures. The study was carried out in the department of Human Anatomy ABU Zaria. The Citrodora oil used was extracted in NARICT Zaria. Two pairs of neutral buffered formalin-fixed brain and liver tissues were histologically processed and stained. One pair was cleared and dewaxed in xylene during the tissue processing and staining, while the other pair was treated similarly in Citrodora oil under the same condition. The paraffin sections were stained with H and E, Gordon and Sweet and Golgi, employing the method of Bancroft and Steven 2008. The section and staining quality was evaluated by direct microscopic observation and graded as described by Kunhua, 2012. Data generated were analyzed using SPSS version 20.0. Results from this study showed a similarity in the efficacy of Citrodora oil and xylene as clearing and dewaxing agent and no significant difference (p≥0.05) in section and staining quality when compared. In conclusion, Citrodora oil can be an effective, eco-friendly, and safer alternative to xylene as a clearing and dewaxing agent in the histology /Histopathological laboratories.

Keywords: Citrodora oil, clearing, staining, xylene and alternative.

INTRODUCTION

Biological tissues have to undergo series of ’tissue clearing agents such as: xylene, toluene, chloroform, acetone, kerosene, diaxane, benzene, petrol, methyl salicylate and cedar wood oil. Most clearing agents are processing’ procedures before they are ready to be examined under the microscope. The various steps of tissue processing include fixing, dehydration, clearing and infiltration. Clearing refers to the process of replacing the dehydrant with a substance that is miscible with the embedding medium. It is one of the most critical steps of tissue processing and largely affects the clarity of the final section and hence the precision of diagnosis.

Clearing agents are used to remove alcohols from the tissue before the tissue can be infiltrated with paraffin wax. Clearing agents are sometimes called “de-alcoholization agents” or ante medium. They act as intermediary between the dehydrating and infiltrating solutions. They are miscible with both solutions and have refractive indices similar to proteins with different levels of toxicity (Kieranan, 2010). Most Histology and Histopathology Laboratories use either aromatic solvents, such as xylene, toluene or aliphatic petroleum distillates for the purpose of clearing and de-waxing in the paraffin histological technique (Ankle and Joshi, 2011). There are many

derivatives of aromatic hydrocarbons such as benzene, while others are derived from natural essential oils such as cedar wood oil and olive oil (Hans et al., 1995).

Xylene has probably been the most commonly used chemical in the histology laboratory despite its hazards. Xylene is an aromatic hydrocarbon consisting of a benzene ring with two methyl substituent (C6H4 (CH 3)2 ). It is expensive, but work well for short time clearing of small tissue blocks. Its high solvency factor allows maximum displacement of alcohol and enhancing paraffin infiltration. (Tardif and Brodeur1992, Carson and Hladik, 2009). Xylene does tend to harden tissues a little, but this does not usually interfere with sectioning qualities.(Kieranan, 2010). Long term immersion of tissue in xylene results in tissue distortions (Visfeldt et al., 1982). Xylene has been reported to affect skin, eyes, nervous system, blood, liver and kidneys of animals exposed to it and it can potentially contaminate the working environment (Ankle and Joshi, 2001).

The need to reduce laboratory hazard has been a challenge.

During tissue processing and staining, most of the clearing agents used are among the most noxious and hazardous chemicals with different levels of toxicity (Dapson and Richard, 2005. Several toxicities believed to be caused by intermediate products of xylene metabolism, such as metylbenzaldehyde have been reported by Indu et al., 2014). These include central nervous system disorders, respiratory depression, abdominal pain, dryness and redness of skin, dermatitis, liver diseases, nephrotoxicity, conjunctivitis, and teratogenic and fetotoxic effects. These are in addition to environmental pollution from unsafe disposal of xylene (Ankle et al., 2011) and tissue distortions as a result of long-term immersion of tissue in xylene (Hans et al., 1995).

There have been several attempts to substitute xylene as clearing agent. Recently, xylene alternatives as clearing agents was developed by mixing vegetable oils such as groundnut oil, palm kernel oil and coconut oil either alone as mixture with other clearing agents (Adeneyi et al., 2016). Orange based oil as clearing agents has also been reported by Rene (2000). Some essential oil such as olive, Clove, Coconut oil and Cedal wood oil has been reported (Hans et al., 1995). However, most of these commercially available xylene alternatives are less effective, more expensive, and are not as readily available as xylene (Gosselin et al., 1984; Amdur et al., 1991; Luna, 1992). To the best of our knowledge, there is little or no report of work on the use of Citrodora oil as xylene substitute in tissue processing. Most of these commercially available xylene substitutes are less effective, more expensive, not readily available and are constitute health hazard as or more than xylene itself (Udonkang et al.,2014).

Citrodora oil is extracted from the Eucalyptus plant which belongs to the; Kingdom: Plantae.Order: Myrtales. Family: Genus: Backhousia. Species: Backhousia citriodora. Citrodora oil is a concentrated hydrophobic liquid containing volatile aroma compounds (Pino et al., 2006). It is extracted from the leaves of Eucalyptus plant and also known as eucalyptus oil. It is an essential oil with a clear, sharp, fresh and very distinctive smell, is pale yellow in color and watery in viscosity (Julia, 995). It has molecular weight of 154.25 and the structural formula of C10H180. The main chemical components of citrodora oil are a- pinene, b-pinene, a-phellandrene, 1,8-cineole, limonene, terpinen-4-ol, aromadendrene, epiglobulol, piperitone and globulol. It has been reported to be nontoxic, nonhazardous, nonflammable, biodegradable and used in aromatherapy (Jean-francois, 2011).

MATERIAL AND METHODS

The essential oil of eucalyptus plants was extracted in National Institute for Chemical Research Technology (NARICT), Zaria by hydro distillation method.

500g of the fresh leaves of eucalyptus and citrus peel was separately weighed and packed into a distillation flask fitted with condensers. Heat was supplied to the flask through a steam generator at constant flow. The essential oil which vaporizes with the steam was condensed into a collecting funnel. The oil was then separated by gravity, dried over anhydrous sodium sulphate, measured, labeled and stored in a brown bottle.

Experimental Protocol

The tissues were taken in pairs. One pair is labelled as Citrodora Tissue and the other as Xylene tissue. The two pairs of brain and liver tissues, 5mmx5mm x3mm thick neutral buffered formalin fixed, were histologically processed simultaneously by dehydration, clearing. Infiltration and embedding. All the tissues were subjected to the same treatment except for the clearing. The Citrodora pair tissue was cleared and dewaxed in Citrodora oil while the Xylene pair tissue was cleared and dewaxed in xylene

Figure I: Eucalyptus plant. Source: Biological Technology Co.Ltd

during the processing and staining respectively. Two paraffin sections of 4 and 8-micron thickness were cut from each of the paired tissue blocks using a rotary microtome (Leica RM2 125 RTS) made in England. Tissues sections sets of 4 microns were stained using Hematoxylin and eosin (H and E) to demonstrate the general tissue structures, Gordon and Sweet for reticular fibers while the brain tissues were stained with Golgi silver stain for nerve fibers. The tissues were dewaxed and cleared with their respective clearing agents during the staining and before cover slipping. The section and staining quality was evaluated by direct microscopic observation and graded as described by Kunhua, 2012. Data generated from the study were expressed as mean plus or minus (±) standard deviation (SD). Student t test was used to compare the efficacy of the Citrodora oil with that of the xylene. Data was analyzed by SPSS 20.0. P value less than or equal to (P ≤ 0.05) were

considered statistically significant.

RESULTS

Table 1.1: Clearing and dewaxing effect of Citrodora oil and xylene on sections and staining quality of liver

Section Quality P value

Citrodora Oil 3.500±1.049

Xylene 4.167±0.753

Staining quality (H and E)

Citrodora Oil 3.333±0.816

Xylene 3.333±0.516

This result indicated there were no statistically significant (P ≥ 0.05) between the Citrodora oil and xylene. At the end of clearing and staining, xylene shows no significant

difference in section quality (4.167±0.753) of liver when compared to Citrodora oil (3.500±1.049).

Table 1.2: Clearing and dewaxing effect of Citrodora oil and xylene on sections and staining quality of Brian

Section Quality P value

Citrodora Oil 3.333±0.816

Xylene 3.500±1.225

Staining quality (H and E)

Citrodora Oil 3.333±1.033

Xylene 3.000±0.894

This result indicated there were no statistically significant (P ≥ 0.05) between the Citrodora oil and xylene. The Brain section and staining quality showed no statistical

significant difference both in section and staining quality.

Photomicrographs of Stained Brain and Liver Tissue Sections

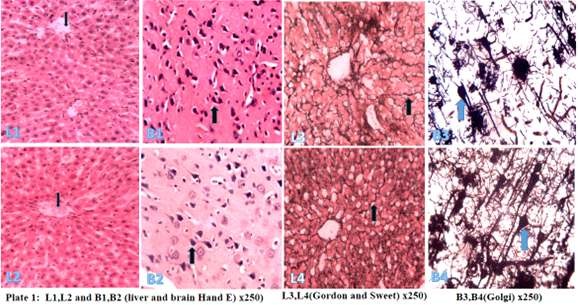
Plate 1: Shows transverse sections of H and E stained liver (L1) and brain (B1) cleared and dewaxed in Citrodora oil and L2 and B2 were cleared and dewaxed in xylene. L3 and L4 are reticular fibers (black arrow) of liver tissue cleared and dewaxed in Citrodora oil and xylene, while B3 and B4 are brain sections demonstrating neurons (blue arrow), were cleared and dewaxed in Citrodora oil and xylene respectively. There was no statistically significant difference across the groups both in the section and staining quality. (H and E X 250).

DISCUSSION

The results of photomicrographs from the present study showed no significant difference in section and staining quality. The present study agrees with the work of Rasmussen et al (1992) on the use of vegetable oils mainly olive and coconut oils instead of xylene in tissue processing, where it was stated that the xylene processed tissues and the vegetable oils’ processed tissues showed only minor or insignificant difference in staining and section quality. According to Kinast (2003), most vegetable oils have higher viscosity between 2 and 5.7 cp at 28% which is reduced by transesterification processes. This may be the reasons for most of the clearing effect on the section and staining qualities observed with some vegetable oil when used as tissue clearing agents. Other physical and phytochemical properties may be responsible for the clearing ability of the Citrodora oil in the present study.

CONCLUSION:

This present study concludes that Citrodora oil can clear and dewax Wistar rat tissues during tissue processing and staining as xylene. Also cytoplasmic and nuclear structures as well as reticular and neural fibers and be demonstrated in Wistar rat tissues cleared in Citrodora oil. Therefore, Citrodora oil can be an effective, eco-friendly and safer alternative to xylene as a clearing and dewaxing agent in the histology /Histopathological laboratory.

Recommendations:

Studies using advanced techniques such as immunohistochemistry, Molecular and enzymatic study, Fluorescence, and electron microscopy techniques of the effects of these essential oils in tissue clearing.

Acknowledgment

The authors sincerely thanked the National Institute for Chemical Research Technology (NARICT), Zaria and their staff for the extraction of the oil, and also the department of human anatomy, Ahmadu Bello University, Zaria for the enabling environment to carry out this work.

REFERENCES
  • Adams, R.P. (2001). Identification of essential oil components by Gas Chromatography and quadruple Mass Spectroscopy. Allured Publishing Corporation Carol Stream IL., SSA, pp 1-698.
  • Awolu, O.O, Obafaye, R.O. and Ayodele, B.S. (2013). Optimization (of Solvent Extraction of Oil from Neem ( Azadirachta indica) and Its Characterizations. Journal of Scientific Research & Reports, 2(1): 304-314.
  • Balch, P.A. (2002). Prescription for Nutritional Healing: the A to Z Guide to Supplements. Penguin. p. 233. 978-1-58333-143-9.
  • Bancroft, J.D. and Stevens (2010). Theory and Practice of Histopathological Techniques 3rd ed P 466. Churchhill Livingstone London, New York.
  • Bancroft, J.D. and Gamble, M. (2008). Theory and practice of Histological Technique.4th Edition. Churchill Living Stone. Britain. p. 84-89.
  • Burke, B.E.. Baillie, J.E. and Olson, R.D. (2004). “Essential oil of Australian lemon myrtle (Backhousia citriodora) in the treatment of molluscum contagiosum in children”, Biomed Pharmacother. 58 (4): 245–247.
  • Caboni, P., Sarais, G., Angioni, A., Garcia, A.J., Lai, F., Dedola, F. and Cabras. (2006). “Residues and Persistence of Neem Formulations on Strawberry after Field Treatment” American Chemical Society, 54 (26), 10026 -10032.
  • Chen, C.Y., He, T., Mao, X.L., Friis, T.E., Qin, R.H., Jian, Y.T., (2010). A novel xylene substitute for histotechnology and histochemistry. Biotech Histochem, 85:231–240.
  • Clark, J.E., Luthy, R.V. (1955). “Separation of Xylenes”. Ind. Eng. Chem. 47(2), 250–253.
  • Dapson, J. and Richard, D. (2005). Hazardous Materials in the Histopathology Laboratory, fourth edition, Anatech, Ltd. 2005
  • Doran, J.C., Brophy, J.J., Lassak, E.V. and House, A.P.N. (2001). “Backhousia citriodora
  • Gilles, M., Zhao, J., An, M. and Agboola, S. (2010). “Chemical Composition and Antimicrobial Properties of Essential Oils of three Australian Eucalyptus Species”. Food Chemistry, 119 (2), 731–737.
  • Gottwald, T.R., Graham, J.H. and Schubert, J.S. (2002). Citrus canker: The pathogen and its impact. Plant Health Progress.
  • Hallur, G., Sivramakrishnan; Bhat, S.V. (2002). “Three New tetranortriterpenoids from Neem Seed Oil” American Chemical Society, 65(8), 1177-1179. 15. Haneke, K.E. (2002). Turpentine [8006-64-2] Review of Toxicological Literature Pub.: National Institute of Environmental Health Sciences.
  • Hans, L., Inger, H., Poul, P. and Eva, B. (1995). Non- hazardous organic solvents in the paraffin embedding technique: A rational approach. Histochemistry, 103:260-269.
  • Hayes, A.J. and Markovic, B. (2002). “Toxicity of Australian essential oil Backhousia citriodora (Lemon myrtle). Part 1. Antimicrobial activity and in vitro cytotoxicity”, Food and Chemical Toxicology 40 (4): 535–543.
  • Jim, S. (2007). Xylene free tissue processing: an evaluation of routine use. Royal Victoria Infirmary, Biopsy Laboratory, Histopathology Department, Newcastle upon Tyne, UK
  • Kieranan, J. A. ( 2010). Histological and Histochemical methods. 4th Edition. Scion publishing limited, Oxford.
  • Kunhua,W.,Chuming,F., Tao,L., Yanmel,Y., Xin,Y., Xiaoming,Z., Xuezhong,G., and
  • Rene, J.B. (2000). Mineral oil: the best xylene substitute. The journal of histotechnology, 3(2)
  • Sakira, F. (2000). The evaluation of an alternative clearing agent to xylene. Clinical Laboratory International.


Association of ABO Blood groups and some diseases–Do Blood groups play a biological role?

Francis Ajeneye*

Pathology Department, Blood Transfusion Maidstone and Tunbridge Well Hospitals NHS Trust, TN2 4QJ, U.K

Oladimeji Olofin

Pathology Department, Haematology Maidstone and Tunbridge Well Hospitals NHS Trust, TN2 4QJ, U.K

Christy Chinyere Fredrick

College of Health sciences, Department of Pathology, University of Abuja, Nigeria All correspondence to: Francis Ajeneye f.ajeneye1@nhs.net

ABSTRACT

The link between ABO/Rh and various diseases have generated much interest over the last decades and have shown some inconsistency. Some diseases are definitely associated with ABO. Do blood groups have biological roles? Many literatures had documented an

association between blood groups and diseases, particularly some neoplasm and hematologic disorders. The loss of blood group A and B antigen expression had been widely documented, which is beyond the scope of this communique. There are also awareness in defining bacterial and parasitic receptors which are closely associated to some known blood groups. Finally, recent studies had observed statistical relationship of blood group with SARS-CoV-2, the association with blood group and SARS-CoV-2 remains insubstantial and evidence must be approached with a sound research design.

Key words: Blood group SARS-CoV-2 Malaria Carcinoma

Over the past few years ABO association with diseases had been widely discussed with emerging research on ABO association and diet, personality and socio-economic statues which is beyond the scope of this short communication.(1,2) Few literatures had proving evidence of increase of group A compared to group with some types of cancer. (3) There is convincing study relating to cancer of the stomach, the association more common in blood group A compared to blood group O. More research across the world agreed with the incidence. ABO association with carcinoma of the stomach seem indisputable(3). Similar association had been also be found in cancer of the colon, and the salivary gland(5). The risk of chorioncarcinoma is critical related to the ABO Blood group of the woman and the partner, women of blood group A with a partner of group O seem to have a highest risk whereas women of blood group A with a partner of blood group A has the lowest risk. There have been some proven relationship of early abortion due to anti-P, Anti-P1 and anti-Pk. The anti-P had been shown to be present in the placenta and anti-PP1PK had been shown to be cytotoxic. (4)

Aird and Bentall (5, 6) showed that group O were 20% more likely to develop peptic ulcer than blood group A. There appears to be a true association between ulceration and absence of secretion. It is not surprising that large quantity of ABH substance are found in the gastrointestinal mucosa,

expression well demonstrated in some human malignancies, the loss of A and B antigen expression was found in 21 of 25 oral carcinoma tumour and correlate with tumour lacking A and B gene expression(7)

There appears to be an association with blood group A, thrombosis, high cholesterol and myocardial infarction. Mourant and colleagues.(8) analysed data from the world literature that patient with thromboembolic diseases include a raised proportion of group A . This applied to women taking oral contraceptive, to pregnancy and puerperal women. There is more evidence of raised thromboembolic episodes in A women than O women. Five year studies found out that A1,B and A1B had a high incidence of myocardial Infarction than O blood group.(9) It was suggested that the etiological pathway of cardiovascular diseases may be differ in patients of different ABO groups owing to difference in their rheology and plasma protein activities.(10,11) These studies consisted of Western Europeans ethnic background, the association did not hold for Asian, African-American or children. It has been shown that cholesterol association may be differ by race.

Mourant(5) made a challenging point earlier that blood

group A individual have a higher level of Factor VIII than group O individual. Group O tend to haemorhage rather than thrombose into the arterial walls thus sustaining more tissue damage. There have also been association with other

failure to secrete ABH substance may lead to peptic ulcer.

coagulation factors such vWF, FV and FIX.(12) Many

There is substantial evidence of decrease activity of glycosyltransferases activities with loss of A and B gene

bacteria such as gram negative organism like Escherichia Coli, have known to have chemical moieties on their

surface that mimics blood group antigens. Springer tested vitro Rosette had been described by to be stronger in

bacteria and found that some bacteria strains showed A, B Group A individuals.(17) The main antigenic ligands

and H (O) specificity.(13) Most blood group scientists responsible for both cytoadherence and antigenic

believe that a similar mechanism must operate in human for the production of naturally occurring antibodies. Small pox virus possess an antigen similar to A antigen, humoral resistance may be more effective in patient with blood group B and O who possess anti-A in their plasma.

The Asian and African distribution of A gene supports the theory of a selective disadvantage among individual infected with smallpox virus. In area like China, India, parts of Russia has a relative increase of the B gene. Resistance to several bacterial and viral infection has been associated with blood groups. Patient with Cholera were likely to be of group O and a one-ninth as likely to be a group AB, several other groups have reported similar associations. (14)

The association of malaria and Duffy blood group system was described by Miller(15), red cell lacking Fya and Fyb were shown to be resistant to the invasion of malaria. It has been shown that black people are resistant to infection by P.Vivax. P.Vivax infection do not occur in individual with Fy(a-b-). The ligand for P. Falciparum is different from the P.Vivax. P.Falciparum invades Fy(a-b-) equally to Fy(a+b+). The parasites exploits adhesion ligands on the endothelial (CD36 and ICAM1), red cell rosette (Blood group A and B), CR1/CD35 and platelets rosettes – platelets glycophorin IV (Cd36) (16) CD36 negative group O appears to be common in malaria endemic areas, this might be a co-incidence or a product of malaria selection, there is also a reduced cyto-adhesion in group O individuals. In-

variation are the members of the P. Falciparum Erythrocyte Membrane Protein-1 (PfEMP1). The encoded PfEMP1var2 carries a two-cysteine-signature associated with rosetting and antibodies to the protein avidly stain the pRBC suggesting that FCR3S1.2 var 2 is the dominant var gene expressed in this parasite.(18)

The parasite ligand-host receptor interactions that mediate cytoadherence is therefore critical to improving our understanding of malaria pathogenesis and developing a vaccine to alleviate disease severity. The second mechanism is to evade specific immune responses through antigenic variation. This involves switching the clonal expression of PfEMP1 antigens, by enabling iRBCs to navigate clear of immunoglobulin (IgG) responses that prevent their cyto-adherence and opsonize them for phagocytosis. PfEMP1 variants thus play a critical role in parasite survival and are prime targets for naturally acquired immunity in African children. Repeating this immunity through PfEMP1 vaccination has been difficult to co-ordinate, especially as thousands of diverse.

There have been other reports associated blood groups with Covid-19, the association of Covid-19 infection and blood groups remains intangible and must be approach with vigilance. The research designs and methodologies identified in recent literatures are not robust and

Cite as: Francis Ajeneye*, Oladimeji Olofin & Christy Chinyere Fredrick (2021). Association of ABO Blood groups and some diseases – Do Blood groups play a biological role?

convincing. A detailed research design that identifies dependent and independent variables and adjust for confounding factors could be a way forward. However, Covid-19 infection could be the results of complex interactions of factors that could vary from genetics, behavioural, metabolic, psychological, social status and environmental risk factors, ABO blood type distribution worldwide varies considerably in different races and should be addressed in studies. In addition to inflammatory response associated with Covid-19 infection,(19) we cannot alterations of the blood group ABO gene in oral overlook mechanism purported by earlier studies that suggested ABO blood group profound influence on the haemostasis, a major determinant of plasma levels of Von

squamous cell carcinoma. Int J Cancer. 2004 Mar 20; 109(2):230-7. doi: 10.1002/ijc.11592. PMID:

14750174.

Willebrand Factor (VWF).(20,21) Literatures also defined

blood group O as a risk factor for increased severe bleeding while blood group non-O is a risk factor for thromboembolic events. The risk of VTE is probably related to the level of VWF and factor VIII in non-group O subjects. A, B, and H blood group antigens are expressed on N-glycans of vWF and influence the half-life of the protein (10 hours for group O and 25 hours for non-O subjects).

CONCLUSION

The relationship between ABO blood groups and overall cancer risk still remains unclear but several meta-analyses conducted over decades suggested there is a strong link. The geographic distribution of ABO antigens worldwide is consistent with a survival advantage in malaria among group O individuals; clinical studies had provided supporting evidence of the effect of ABO group on malaria severity; and that recent discoveries suggest biologic mechanisms linking disease pathogenesis to ABO antigen expression. The mechanisms underlying the associations between ABO blood group and Cardiovascular diseases risk remain unclear, however, several studies of evidence support its potential cardiovascular effects. More research is required to explore and understand the association of Blood groups and SARS-CoV-2.

REFERENCES
  • Golding, J. Hicks, P. Butler NR. Blood group and socio-economic class. Nature 1984; 309; 396
  • Beardmore JA, Karimi-Booshehri F. ABO genes are differentially distributed in socio-economic groups in England. Nature. 1983 Jun 9-15;303(5917):522-4
  • Vogel F. Controversy in human genetics. ABO blood groups and disease. Am J Hum Genet. 1970 Jul;22(4):464-75
  • Lopez M, Cartron J, Cartron JP, Mariotti M, Bony V, Salmon C, Levene C. Cytotoxicity of anti-PP1Pk antibodies and possible relationship with early abortions of p mothers. Clin Immunol Immunopathol. 1983 Aug;28(2):296-303.
  • Aird I, Bentall HH, Mehigan JA, Roberts JAF. The blood groups in relation to peptic ulceration and carcinoma of colon, rectum, breast, and bronchus; an association between the ABO groups and peptic ulceration. Br Med J. 1954 Aug 7;2(4883):315–321.
  • Mourant AE, Kopeć AC, Domaniewska-Sobczak K. Blood-groups and blood-clotting. Lancet. 1971 Jan 30; 1 (7692):223–227.
  • Medalie JH, Goldbourt U. Unrecognized myocardial infarction: five-year incidence, mortality, and risk factors. Ann Intern Med. 1976 May; 84(5):526–531.
  • Dintenfass L, Bauer GE. Dynamic blood coagulation and viscosity and degradation of artificial thrombi in patients with hypertension. Cardiovasc Res. 1970 Jan; 4(1):50-60.
  • Mao, Y., Yang, W., Qi, Q. et al. Blood groups A and AB are associated with increased gastric cancer risk: evidence from a large genetic study and systematic r e v i e w. B M C C a n c e r 1 9 , 1 6 4 ( 2 0 1 9 ) . https://doi.org/10.1186/s12885-019-5355-4
  • Gedde-Dahl TW, Jeremic M, Weisert O. Factor V (proaccelerin) concentration in 1016 blood donors. The effects of age, sex, and ABO blood groups. Scand J Clin Lab Invest. 1975 Jan;35(1):25-30
  • Springer GF. Blood-group and Forssman antigenic determinants shared between microbes and mammalian cells. Prog Allergy. 1971; 15:9-77.
  • Barua D, Paguio AS. ABO blood groups and cholera. Ann Hum Biol. 1977 Sep; 4(5):489-92.
  • Miller LH, McGinniss MH, Holland PV, Sigmon P. The Duffy blood group phenotype in American blacks infected with Plasmodium vivax in Vietnam. Am J Trop Med Hyg. 1978 Nov; 27(6):1069-72.
  • Rug M, Cyrklaff M, Mikkonen A, Lemgruber L, Kuelzer S, Sanchez CP, et al. Export of virulence proteins by malaria-infected erythrocytes involves remodeling of host actin cytoskeleton. Blood. 2014; 124:3459–68.
  • Carlson J, Nash GB, Gabutti V, al-Yaman F, Wahlgren M. Natural protection against severe Plasmodium falciparum malaria due to impaired rosette formation. Blood. 1994 Dec 1; 84(11):3909-14. PMID: 7949147.
  • Kirchgatter K, del Portillo HA: Association of severe no cerebral Plasmodium falciparum malaria in Brazil with expressed PfEMP1 DBL1 alpha sequences lacking cysteine residues. Mol Med. 2002, 8: 16-23.
  • Naitza S, Porcu E, Steri M, et al. A genome-wide association scan on the levels of markers of inammation in Sardinians reveals associations that underpin its complex regulation. PLoS Genet 2012; 8: e1002480.
  • Li J, Wang X, Chen J, Cai Y, Deng A, Yang M. Association between ABO blood groups and risk of SARS-CoV-2 pneumonia. Br J Haematol. 2020 [Epub ahead of print]. DOI: https://doi.org/10.1111/ bjh.16797.
  • Gill JC, Endres-Brooks J, Bauer PJ, et al. The effect of ABO blood group on the diagnosis of von Willebrand disease. Blood 1987; 69:1691-5.
  • Dentali F, Sironi AP, Ageno W, et al. Relationship between ABO blood group and hemorrhage: a systematic literature review and meta-analysis. Semin Thromb Hemost 2013; 39:72-82.
  • Hommel M, David PH, Oligino LD: Surface alterations of erythrocytes in Plasmodium falciparum malaria. Antigenic variation, antigenic diversity, and the role of the spleen. J Exp Med. 1983, 157: 1137- 1148. 10.1084/jem.157.4.1137
  • Gao S, Worm J, Guldberg P, Eiberg H, Krogdahl A, Liu CJ, Reibel J, Dabelsteen E. Genetic and epigenetic


COVID-19 Data Analysis – Predicting Patient Recovery

Arnela Salkić, Nermina Durmić

Department of Information Technologies, International Burch University,

Faculty of Engineering and Sciences, Sarajevo, Bosnia and Herzegovina

All Correspondences to: Arnela Salkić Department of Information Technologies, International Burch University,

Faculty of Engineering and Sciences, Sarajevo, Bosnia and Herzegovina

ABSTRACT

Aim of this paper is to give insight in Covid 19 data and to try to predict whether individual person will recover from this virus. Furthermore, this paper aims to give some answers how information like the country, the age, and the gender of the patient, the number of cases in their country and whether they’re from or have visited Wuhan can be used to make that prediction.

Study uses Novel Corona Virus (COVID-19) epidemiological dataset. Logistic regression model and Random Forest algorithm are used in order to make prediction, and the Chi-Square test of independence is used to determine if there is a significant relationship between two nominal (categorical) variables. Paper reveals that recovery/survival is supposed to depend on the age of the patient, gender and country from which patient come. Information, whether the patient is from Wuhan or has visited Wuhan, does not affect recovery/survival of patient.

Keywords: Covid 19; Pandemic; Logistic Regression; Random Forest; Chi-Square Test.

INTRODUCTION

Coronaviruses are frequent RNA viruses, from the Coronaviridae family, which are responsible for digestive and respiratory infections in humans and animals. The virus owes its name to the appearance of its viral particles, bearing growths which evoke a crown.[1] COVID-19 is the infectious disease caused by the last coronavirus that was discovered. This new virus –and disease- was unknown before the outbreak occurred in Wuhan, China in December 2019. COVID-19 is now pandemic and affects many countries around the world. The most common symptoms of COVID-19 are fever, dry cough, and fatigue. Other less common symptoms may also appear in some people, such as body aches and pains, nasal congestion, headache, conjunctivitis, sore throat, diarrhea, loss of taste or smell, rash, or discoloration of the fingers on the hand or foot. These symptoms are generally mild and appear gradually. Some people, although infected, have only very mild symptoms.[2]

Most patients (approximately 80%) recover without the need for hospitalization. About one in five people with the disease have severe symptoms, including difficulty breathing. Older people and those with other health conditions (high blood pressure, heart or lung problems, diabetes or cancer) are more likely to have serious symptoms. However, anyone can get COVID-19 and become seriously ill. People of any age who have a fever and or cough associated with difficulty breathing / shortness of breath, chest pain / pressure, or loss of speech or difficulty getting around should see a doctor immediately. It is recommended, if possible, to call the care provider or health facility in advance, so that the patient is referred to the appropriate service.[2]

Data science will play a main role in the global response to the Covid-19 pandemic by analyzing data which is collected daily and by searching patterns in those datasets which would help humanity to fight pandemic.

Aim of the study is to give insight into Covid-19 pandemic by bringing answers like whether information like the country, the age, and the gender of the patient, the number of cases in their country and whether they’re from or have visited Wuhan can be used to predict whether a random patient whose data we have will recover from this virus. The purpose of this study consists in providing prediction model for future recovery trend which can be used to specify additional measures which would help fighting Covid 19 pandemic.

This paper is organized as follows: section 2. Where several studies about Covid 19 topic have been reviewed and where research question of this paper have been introduced. In section 3. Used datasets and details have been presented as well as methods which were used to get answers about Covid 19 which later lead to the final conclusion about research question. Results are presented in section 4. Using visualization for better understanding, while last two sections 5. And 6. Are discussion and conclusion about conducted study.

LITERATURE REVIEW AND RESEARCH QUESTION

Previous studies and data exploration have been made concerning this topic, however the goal of each study differs. For some data scientists on Kaggle, the model to develop was a regression model to predict the number of cases each day in each country. These studies findings suggested that China and Italy, who were the first to contract the virus, didn’t record many cases during the month of January and then skyrocketed to the top of the coronavirus world meter list, which conveys that the virus spreads at a very high speed. The most affected countries were also in the northern hemisphere, hence the hope that the virus would disappear little by little as the weather around the globe gets calmer. The findings also included China’s astonishing results after lockdown which encouraged many countries to also undergo a confinement mode. Models used comprised of linear regressors and learning algorithms such as XgBoost. [3][4]

Nadia AL-Rousan and Hazem AL Najjar in their work [5] are analyzing Covid-19 pandemic in South Korea based on recovered and death cases. Their study is based on statistically analysis the effect of factors such as region, sex, birth year, infection reasons and released or diseased date on the reported number of recovered and deceases cases. The X2 test is used to find the impact of the previous attributes on the number of recovered and deceases cases. Result of their work shows that confirmed date and infection reasons do not affect deceased cases, while on the other side confirmed date and region variables are significant with recovered cases. Besides, the results found that multinomial logistic regression could give initial indicator about the possibility to survive or die based on the collected data. It is found that the results of multinomial logistic are in line with the results of the X2 test.

Dr. Anis Kouba in his work [6] aims to answer several questions about Covid-19 pandemic: How does COVID-19 spread around the world? What is its impact in terms of confirmed and death cases at the continent, region and country levels? How does its severity compare with other epidemic outbreaks, including Ebola 2014, MERS2012, and SARS 2003? Is there a correlation between the number of confirmed cases and death cases? Data analysis is based on Novel Coronavirus COVID-19 Data Repository provided by Johns Hopkins University. Tableau Professional software was used to analyze the collected data and to develop visualization dashboards about the Coronavirus disease. Methodology consists in creating descriptive models of the Coronavirus outbreak using statistical charts to understand the nature of the spread and its impact. Analysis was developed at three levels, namely, at the country-level, at region-level and continent-level. Each level provides different granularities towards understanding the distribution of the disease around the world. The descriptive model provides different types of statistical charts, including bar charts, geographic maps, heatmaps, box plot, and packed bubbles, to represent different features of the COVID-19 outbreak. Dr.Kouba also develop some predictive models using linear and polynomial regressions to predict the evolution of the outbreak, given the historical data.[6]

In [7], the authors investigated the impact of preventive measures, such as social distancing, lockdown in the containment of the virus outbreak. They developed prediction models that forecast how these measures can reduce the mortality impact of aged people. Mathematical model is performed on the spread of the Novel dataset coronavirus that considers both, the age and social contact structure. Authors conclusion is that the three-week lockdown will be insufficient in India. Their model suggests that sustained periods of lockdown with periodic relaxation will reduce the number of cases to levels where individualized social contact tracing and quarantine may become feasible.

The authors of [8] addressed the question about how the virus has spread from the epicenter of Wuhan city to the whole world. They have also analyzed the impact of preventive measures such as quarantine and city closure in mitigating the adverse impact of the spread. The authors have demonstrated visual graphs and developed a mathematical model of the disease transmission pattern.

Research question of this paper aims at studying the chances that a patient diagnosed with Covid-19 must recover from this illness. This research aimed to identify which information (variables) about patient are dependent with patient recovery. Questions which are stated at the beginning of this study are: whether patient age is important in patient recovery/survival; whether patient gender is important in patient recovery/survival; whether information is patient from Wuhan or has visited Wuhan is important in patient recovery/survival; whether patient country from which comes from is important in patient recovery/survival. It is a classification problem (target variable is a response “Survived” 0 or 1) rather than a regression problem.

METHODOLOGY

A. Data Collection

With more than 10 million cases worldwide among with only half have recovered while the other half remains active, 500 000 deaths, the Coronavirus has become a pressing issue in every part of the world.

Because no country knows precisely the number of infected people among its citizens, the number of cases relies on the tests that the country performs and provides for the people.

In the data-oriented world that we live in today, all countries have been keeping track of all tests that they’ve done daily along with the results. Which fortunately enabled us to do this study.

Both datasets that have been worked with have been retrieved from Kaggle. The data set is the “Novel Corona Virus (COVID-19) epidemiological dataset”. The data is compiled by the Johns Hopkins University Center for Systems Science and Engineering (JHU CCSE) from various sources including the World Health Organization (WHO), DXY.cn, BNO News, National Health Commission of the People’s Republic of China (NHC), China CDC (CCDC), Hong Kong Department of Health, Macau Government, Taiwan CDC, US CDC, Government of Canada, Australia Government Department of Health, European Centre for Disease Prevention and Control (ECDC), Ministry of Health Singapore (MOH), and others. JHU CCSE maintains the data on the 2019 Novel Coronavirus COVID-19 (2019-nCoV) Data Repository on Github.[9]

This dataset contains 2 files, the first file “time_series_covid_19_recovered.csv” which provides us with daily information on the affected people in about 200 countries from the 22nd of January 2020 to the 16th of April 2020, and the second data set “COVID19 linelist data.csv” that contains observations of patients around the world where authorities have kept track of confirmed cases, recoveries and deaths.

B. Data Analysis Method

This study consists of exploring the two datasets thoroughly, understanding the variables and seeing their distributions, visualizing the evolution of numerical variables (time series of the numbers of cases in each country) and relationships between categorical ones (statistical testing). Afterwards, a simple logistic regression was performed to predict whether a patient recovers from Covid19 or not and some clustering techniques have been used to try to understand better recovery rates and how it is linked to the age of the patient. Logistic regression model and Random Forest algorithm are used, and the Chi-Square test of independence is used to determine if there is a significant relationship between two nominal (categorical) variables.

Author of the paper would have opted for Text analysis of the columns “Summary” and “Symptoms” but were unable to do so due to lack of data (portion of Nas in the columns). However, other analysis methods have been used such as descriptive data analysis for the time serial evolution of the number of cases and inferential data analysis when performing statistical tests to reveal the dependence between some variables.

To conclude with predictive analysis with “Survived” as a target variable based on a percentage that conveys how much a patient is likely to be treated and survive the virus.

C. Data Cleaning and Preprocessing

Some countries are divided into provinces/district in both datasets. At first, it has been thought that each district has to be treated individually in order to join the two datasets. But different regions exist in the two data frames, most importantly some regions in the patients list do not exist in the time series data frame and would therefore stay empty if this data frame was filled with the number of cases by specific regions of a country. Which is why was decided to eliminate regions and work with total numbers of cases in a country.

Taking care of Nas is a very important part of every data exploration process. Using the ggpubr library in R, the number of Nas was visualized in each variable of the dataset and decide to get rid of all variables that contain more than 250 Nas (a little less than the 1/4th of the data). Following variables were selected to continue this study: age, gender, number of cases in country, from Wuhan, visiting Wuhan, death, recovery and country.

D. Visualization

* Plotting time series(number of cases by country)

In the initial time series data frame, each day is a variable and that is not a proper structure for visualizing time series. A series of steps is required to obtain a data frame that can be worked with:

  • The data frame was transformed to have a column where each line is a day
  • The header was removed and some variables that will not be used for this visualization
  • All variables were converted to numeric type
  • The created column containing dates was set as date-time so that it is recognizable as such by R when dates on the x-axis were plotted.

The number of cases per country were chosen to be visualized continent by continent. Those graphs will enable to follow a country’s covid-19 outbreak and perceive at what moment the exponential spread has started. * Plotting survival against other categorical data

Using the ggplot2 library in R, data set has been grouped by category of the qualitative variable against which Survival using the “group_by” method was plotted.

The result is a histogram illustrating the counts of Survival values (0 or 1) in each category.

E. Chi-Square Test of Independence

This test is used to assess the existence or not of a relationship between two characteristics within a population, when these characteristics are qualitative or when one characteristic is quantitative and the other qualitative, or even when the two characteristics are quantitative but that the values have been combined. Note that this test makes it possible to check the existence of a dependence but in no case the direction of this dependence. Like in any statistical test, there is a null hypothesis H0 that has to be tested – determine whether there is enough evidence to “reject” this hypothesis. For this study test there is:

H0 : the two variables are independent

H1 : the two variables are not independent

á = 0.05 : tolerated risk

The mathematical steps were hardcoded into R to perform this test. The statistic that need to be calculated to perform this test is the following:

Where O is the observed score and E is the expected score. [10]

The observed scores are in a table of the values that already exist in our dataset and are already in our disposition. The expected scores table is one of the same dimensions as the observed scored. It is obtained by multiplying each value of the observed values with the sum of its row and dividing by the total number of observations.

Once these two tables are set, it can be proceeded to calculating the chi-squared statistic. The pvalue is calculated then. This is done by calculating the chi statistic for multiple random samples of our data, the pvalue is the proportion of the X2 statistic that are higher than the real X2 statistic of the sample.

If pvalue < 0.05 the null hypothesis is rejected, meaning that the two qualitative variables are independent.

If pvalue . 0.05 the null hypothesis is accepted, meaning that the two qualitative variables are dependent.

RESULTS

After cleaning and preprocessing the two datasets here are the resulting data frames that have been used for this study. There are 85 countries in the first data frame and the number of cases that appear each day in that said country.

Table 1

After cleaning the observations file and removing the variables that contained too many NAs, the following variables were decided to be kept: age, number of cases in country, gender, from Wuhan, visited Wuhan and the country of the patient. The two datasets were also joined by summing the number of cases during each month that was available in the first time series dataset for each country.

Table 2

By joining two datasets, plotting the evolution of cases in each country during these 4 months was also possible. Figure1 shows the results for the most popular countries during this pandemic (those that have been hit the most and most spoken of in the news).

Fig 1:- Countries affected the most with Covid-19

As it can be noticed, China, the epicenter of this pandemic, was the first to witness an exponential rise in the number of cases early February. The other countries followed suite during the month of March.

To extract some insights from the data concerning the relationship between the survival of the patient and their gender and age was also possible. As it might have been expected before, gender is independent of the survival of the patient, but age does play a role in whether a patient will recover or not.

Fig 2:- Recovery by gender

Fig 3:- Recovery by age

Another thing that might have been suspected is that a person would be less likely to recover if they’re coming from

Wuhan or if they’ve visited Wuhan. Here are the illustrations from the data:

Fig 4:- Recovery dependency if patient visited Wuhan or not

To confirm these hypotheses, and because these are categorical variables, it has been decided to do a Chi-square test of independence to see whether survival was dependent on any of those variables. Results are summarized in the following table:

Table 3:- Categorical variables dependency

The final step of the study was creating a classification model with the data that have been prepared and try to predict whether a person would survive the virus or not. The logistic regression model gave an accuracy of 84% and random forest one of 91%. Random forest gave a better result than logistic regression because the model weighs certain features as more important than others (feature selection), the absence of assumption of a linear relationship like regression models do, and because random forest takes random samples from the data set, forms many decision trees, and then averages out the leaf nodes to get a clearer model (ensemble learning).

DISCUSSION

The analysis confirms that it is indeed possible to predict the recovery -or no- of a covid19 patient given some information about his situation such as age, gender, and the country it comes from. It is to author grand surprise that the statistical tests indicate that the Survived variable is actually dependent on the gender of the patient. Figure2 shows that males are more likely to be infected than females, based on data in our dataset. On the other hand, whether the patient is from Wuhan or has visited Wuhan does not affect in any way the outcome of the observation – author expectations were otherwise.

In line with this research paper question testing, Survival is supposed to depend on the age of the patient as all of us have witnessed during the previous months. The death rates were particularly high for the elderly while adults, teenagers and kids seemed to recover way more successfully from the illness. The country is also supposed to affect the outcome of the treatment since the latter depends on the country’s means and dispositions to treat the patient. This study can contribute to predict future pandemic recovery trend by giving global picture of how many patients could be recovered from this virus and based on that information define further measures which can be overtaken. Future studies should take into account some variables that were in the “COVID19_line_list_data.csv” dataset but that couldn’t have been used because of the number of missing data in those columns, these columns include : “cases_in_country”, “reporting_date”, “symptoms_on_set”, “host_visit_date”, “exposure_start” and “exposure_end”. This information would certainly have been valuable to predict the survival of the patient.

CONCLUSION

This research aimed to identify which variables -pieces of information- about a patient is important to predict whether a person diagnosed with covid19 would survive the virus or not. Results conveyed that age, gender and country are the variables on which the target variable Survived depends.

Further research is needed to determine the reliability of these results since the dataset that have been worked with contains data until April 2020 only, while the pandemic is persisting and will still persist in the future.

REFERENCES

  • Wikipedia. (July 2020). Coronavirus disease 2019 (Online). A v a i l a b l e : h t t p s : / / e n . w i k i p e d i a . o r g / w i k i / Coronavirus_disease_2019
  • World health organization. (July 2020). Coronavirus disease ( C O V I D – 1 9 ) p a n d e m i c [ O n l i n e ] . Av a i l a b l e : https://www. who . int/emergencies/diseases/novel – c o r o n a v i r u s – 2 0 1 9 ? g c l i d = E A I a I Q o b C h M I n L X X _b2G6wIViqkYCh21BgipEAAYASAAEgIAdvD_BwE
  • Kaggle competition.(July 2020). COVID19 Predictions u s i n g X G B O O S T [ O n l i n e ] . A v a i l a b l e : https://www.kaggle.com/anshuls235/covid19-explained-through-visualizations
  • Kaggle competition.(July 2020). Nischay Dhankhar. Covid19 Week5 (Visuals+RandomForestRegressor) [ O n l i n e ] . Av a i l a b l e : h t t p s : / / w w w. k a g g l e . c o m /nischaydnk/covid19-week5-visuals-randomforestregressor
  • N. AL-Rousan, H. AL-Najjar, April 2020, “Data analysis of coronavirus COVID19 epidemic in South Korea based on recovered and death cases”, Journal of Medical Virology [Online]. Available: https://onlinelibrary.wiley.com/ doi/full/10.1002/jmv.25850
  • Koubaa, Anis. (March, 29th 2020). “Understanding the COVID19 Outbreak: A Comparative Data Analytics and Study” [Online]. Available: https://www.researchgate.net/ publication/340331977_Understanding_the_COVID19_O utbreak_A_Comparative_Data_Analytics_and_Study
  • Singh, Rajesh & Adhikari, Ronojoy. (2020). “Age-structured impact of social distancing on the COVID-19 epidemic in India” [Online] . Available: https://github . com/ rajeshrinet/pyross
  • B. Chen, M. Shi, X. Ni, L. Ruan, H. Jiang, H. Yao, M. Wang, Z. Song,Q. Zhou, and T. Ge, “Visual data analysis and simulation prediction for covid-19,” 2020, Cornel University, Physics, Medical Physics [arXiv:2002.07096]
  • Kaggle, July 2020, Novel Corona Virus (COVID-19) e p i d e m i o l o g i c a l d a t a s e t [ O n l i n e ] . Av a i l a b l e : https://www.kaggle.com/sudalairajkumar/novel-corona-v i r u s – 2 0 1 9 – d a t a s e t # t i m e _ s e r i e s _ c o v i d _ 1 9 _ confirmed_US.csv
  • Statistics Solutions, July 2020, Chi-Square Test of Independence [Online], Available: https://www.statisti cssolutions.com/non-parametric-analysis-chi-square/
  • Kaagle, July 2020, COVID19- Inside Story of each Countries [Online]. Available: https://www.kaggle.com/pradeepmuniasamy/covid19-inside-story-of-each-countries
  • Latif, Siddique & Usman, Muhammad & Manzoor, Sanaullah & Iqbal, Waleed & Qadir, Junaid & Tyson, Gareth & Castro, Ignacio & Razi, Adeel & Kamel Boulos, Maged & Crowcroft, Jon. (2020). “Leveraging Data Science To Combat COVID-19: A Comprehensive Review”. Research gate,10 . 13140/RG . 2 . 2 . 12685 . 28644/4 . Available: https://www.researchgate.net/publication/340687152_Leve r a g i n g _ D a t a _ S c i e n c e _ T o _ C o m b a t _ C O V I D – 19_A_Comprehensive_Review#pf2
  • Medium March 2020, R Tutorial: Analyzing COVID-19 Data, Introduction to using R in the real world [Online]. Available: https://towardsdatascience.com/r-tutorial-analyzing-covid-19-data-12670cd664d6
  • Opuszko, Marek. (2020). Analytics of the COVID-19 (Corona) Spread using R [Online] . Available: https://www.researchgate.net/publication/340412951_Anal ytics_of_the_COVID-19_Corona_Spread_using_R.


The Role of Ascorbic acid on Mercury Induced Hippocampal (CA1 and CA3 region) Damage and Memory impairments in rats.

Animoku Abdulrazaq A., Suleiman Muritala O.

Department of Anatomy, Kogi State University, Anyigba-Nigeria

Mesole Samuel Bolaji

Department of Human Anatomy, School of Medicine, Texila American University, Zambia

Suleiman Haruna O., Aliyu Fati O.

Department of Physiology, Kogi State University, Anyigba-Nigeria

Yusuf Uthman Ademola

Department of Human Anatomy, Mulungushi University-Zambia

Ivang Andrew

Clinical Anatomy Unit, Department of Clinical Biology, CMHS, University of Rwanda

Animoku Abdulrazaq A., Mesole Samuel Bolaji

Department of Anatomy, Ahmadu Bello University Zaria-Nigeria

All Correspondences to: Animoku Abdulrazaq email:animokuaa@gmail.com

ABSTRACT

Introduction: Mercury is well known hazardous environmental contaminants with potential for global mobilization following its give off through air, soil, water and food while central nervous system has been shown to be the main target. Aim: The present study emphasis the effects of ascorbic acid administration against hippocampal damage and spatial learning impairments induced by mercury exposure in Wistar rats. Methods: Twenty five wistar rats (average weight 185 g) were randomly divided into five groups of five rats per group. Earlier the rats were trained for spatial navigation task in Morris water maze for 7 days and were simultaneously treated with mercuric chloride (49.8mg/kg) orally for 21 days, the animals were further subjected to ascorbic acid (595 mg/kg and 1,190 mg/kg) treatment orally for 21 days. After each administration the rats were tested for retention of spatial learning and memory in Morris water maze and latency were determined. The normal pyramidal cell density in the CA1 and CA3 region of hippocampus was also counted. Results: Results revealed histological alterations in hippocampal regions; (CA1 and CA3) involving necrosis, neuronal vacuolation, neuronal degeneration, pyknosis, cytoplasmic shrinkage and reduction in pyramidal cell density (p<0.05) in HgCl2 intoxicated groups. The results from Morris water maze navigation test showed significant increase (p<0.05) in mean latency time taken by the animals to locate the hidden platform in mercury treated groups when compared to animals in the control and ascorbic acid treated groups, suggestive of neurological toxicity of mercury to learning and memory loss and ameliorative potential of ascorbic acid. Conclusion: The outcome of this study suggests that ascorbic acid could ameliorate pyramidal cell damage of CA1 and CA3 region of hippocampus and retention of hippocampal associated spatial learning and memory in rats treated with ascorbic acid, this finding confirms the ameliorative role of ascorbic acid against mercury induced neurotoxicity.

Key words: Mercury, Hippocampal region (CA1and CA3), cognition, memory, Ascorbic acid.

INTRODUCTION

eavy metals and organic compounds have the Hcapacity to damage the nervous system. These compounds include mercury, arsenic, lead, manganese, thallium, cadmium, dichlorodiphenyl-trichloroethane (DDT) etc. The toxic effects of these compounds are variable and diffuse, involving different parts of nervous system as well as other organ systems (Maurice and James, 1972; Volko et al., 2005).

Mercury is highly toxic heavy which has been a major nervous system problem over decades (Brian and Fred, 1995), it is a potential factor in brain damage (Ibegbu et al., 2013; 2014), mental impairment and behavioral anomalies (Sadeeq et al., 2013).

Mercury is highly toxic heavy metal present in the environment via air, food and water (Wade et al., 2002; Burger et al., 2011). Most of the mercury in the environment results from human activity, particularly from coal-fired power stations, residential heating systems and waste (WHO, 2005). Mercury also enters the environment from fertilizers, fungicides and from solid wastes; thermometers or electrical switches (Department for Environment Food and Rural Affairs, 2002; Zhang 2002). Mercury exists in three (3) forms namely; elemental, organic and inorganic mercury (WHO, 2005; Burger et al., 2011).

Many populations Worldwide have been exposed to mercury through the consumption of fishes and sea foods (European Commision, 2005), dental amalgam and mining of gold, silver in industries (WHO, 2007). There are many reported cases of mercury food poisoning in Sweden, Mexico, USA and the Minamata Bay incidence that led to the poisoning of over 800 people (WHO, 2005). In Nigeria, Tilapia fishes from Lagos Lagoon and the use of “Kohl” a traditional cosmetic had been reported as an agent of mercury toxicity (Onyeike et al., 2002).

Some of the symptoms reported from mercury poisoning include, excitability, restlessness, irritability, irrational outburst of temper, depression, headache, dizziness, itching and pain (Grant and Lipman, 2009; WHO, 2005) while, tachycardia, frequent urination, salivation, hypertension, inactivity, memory impairment and insomnia were also reported in mercury exposed individuals (WHO, 2005; ATDRS, 2011). The excretory pathways of mercury compounds are urine, feces, expired air, sweat and saliva (Booth and Zeller, 2005; WHO, 2007). Ascorbic acid is well known for its antioxidant activity acting as a reducing agent to reverse oxidation in liquids and lipoproteins in various cellular compartments and tissues (Padayatty et al., 2003; Ibegbu et al., 2014). It is primary first-line protective agent that nullifies free radicals by donating a single electron to yield dehydro-ascorbic acid (Valko et al., 2005; UKFSA, 2007; Gemma et al., 2010). Ascorbic acids can scavenge free radicals (Padayatty et al., 2003), prevent scurvy (WHO, 2001), pneumonia (Hemila and Louhiala, 2007) and are useful in lowering the incidence of gout (Choi, et al., 2009). Ascorbic acid is absorbed in the body by both active transport and simple diffusion (Savini, et al., 2007). Sources of ascorbic acid are fruits, vegetables, liver, nutritional supplement, tablets, drinks (Wilson, 2005) and animal products (United Kingdom Food Standard Agency, 2007). Aim: The present work was aimed at evaluating the role of ascorbic acid on mercury induced hippocampal damage, learning and memory impairments in rats.

MATERIALS AND METHODS

Twenty five (25) Adult Male Wistar rats of average weight 185g were used for this study. After acclimatization in the Animal House of the Department of Human Anatomy, Ahmadu Bello University, Zaria, the animals were grouped into five groups of five animals each (n = 5). Mercuric chloride (X-N202, May and Bakers, England) was utilized at LD50 of 166 mg/kg body weight as adopted from ATSDR (2011).While; the LD50 of ascorbic acid (S42238, Sam Pharmaceuticals, Nigeria) was adopted from MSDS (2008) as 11,900 mg/kg body weight. The mercury chloride was the approved laboratory grade chemical by Standard Organization of Nigeria, marketed and sold in Nigeria, while the ascorbic acid tablets was approved by

National Agency for Food and Drug Administration and Control to be marketed and used in Nigeria. Before the commencement of the study, ethical approval was sort and obtained from the Ahmadu Bello University Zaria Ethical and Animal Use Committee, Faculty of Veterinary Medicine. The animals were dosed as follows: control group was administered with normal saline, group II with 30% mercuric chloride (HgCl2, 49.8 mg/kg) only, group received HgCl2 with distilled water only, group IV received HgCl2 with 5% low dose ascorbic acid (595 mg/kg), while group V received HgCl2 with 10% high dose ascorbic acid (1,190 mg/kg). However, administrations of distilled water and ascorbic acid from weeks 3-6 were done in order to observe for any possible natural recovery and possible ameliorative potentials of ascorbic acid respectively (Table 1). The administration was by oral route daily and lasted for 3-6 weeks, while animal feed and water were allowed ad libitum.

Table 1: Animal grouping, number of rats, treatment and duration of administration of mercuric chloride and ascorbic acid

Groups Dosage/kg body weight Treatment
(n=5) Duration
(weeks)
I Distilled water (Control) 1 – 3
II 49.8mg/kg of mercuric chloride 1 – 3
III 49.8mg/kg of mercuric chloride 1 – 3
and
Distilled water 3 – 6
IV 49.8mg/kg of mercuric chloride 1 – 3
and
595mg/kg of ascorbic acid 3 – 6
V 49.8mg/kg of mercuric chloride 1 – 3
and
1,190mg/kg of ascorbic acid 3- 6

Animal Sacrifice

After the administration, the animals were anaesthetized by inhalation of chloroform in the sacrificing chamber. The skull was opened with the aid of brain opener through a mid sagittal incision while brain tissues were removed and fixed in Bouin’s fluid for fast fixation. The tissues were routinely processed for paraffin embedded histology and stained using Hematoxylin and Eosin (H&E) staining method.

Tissue processing technique

Brain tissues were allowed to stay in Bouin’s fluid for 48 hours for proper fixation. The tissues were prepared using routine Hematoxylin and Eosine staining technique processing unit Histology laboratory of Human Anatomy Department, Ahmadu Bello University, Zaria. The brain tissues were processed routinely and stained using routine H and E technique.

Neurobehavioral test; spatial learning and memory test using Morris water maze

Morris water maze test was used to develop and test spatial learning and memory in the test animals according to the methods of Morris (1981), which was further modified by Mark et al. (2007) and Liu et al. (2011). According to this method, each animal was placed in a small pool of water which contained anescape platform, hidden a few millimeters away and beneath the water surface. The animal task was to locate the hidden platform. The animal starting point was changed from time to time so as to build a cohesive spatial representative of the pool in order to find the platform during training trials and the latency to find the platform location was recorded during the training and weekly during the experimental periods. Animals were placed in circular pool of clear water which was partitioned into four quadrants. Each animal’s starting point was in a random position and each animal swam from one quadrant to the other searching for an escape route. The time taken by each animal to locate the platform (escape route) was recorded as latency period in seconds.

Cell Count Analysis

Hippocampal CA1 and CA3 Pyramidal cells were counted u s i n g D i g i m i z e r i m a g e a n a l y s i s s o f t w a r e . Photomicrographs of hippocampal regions were uploaded into the image area of the software. A marker tool was used to mark and count cells in the aforementioned region. The numbers of the counted cells were automatically indicated on the statistics area of the software, while results obtained were further subjected to statistical analysis.

Statistical Analysis

Results were analyzed using the Statistical package for Social Scientist (SPSS version 20) and the results were expressed as Mean ± SEM. The Statistical significance between means were analyzed using one-way analysis of

variance (ANOVA) followed by post HOC test; Tukey’s multiple comparison test was utilized to test for significant difference between control and experimental groups. A p-value < 0.05 was considered significant.

RESULTS:

Physical observation of the animals

On physical observation, the control group animals were physically, behaviorally and mentally stable while mercury treated animals were observed to be ataxic, agitated, distressed, apathetic with diarrhea during the first 3 weeks of administration. However, improved physical activity, agility, and behavioral stability were noted in animals treated with ascorbic acid in the last 3 weeks of administration.

Histological Observations

The brain sections stained with H&E stain obtained from

Group I rats reveal intact morphology and cytoarchitecture of hippocampal CA1 and CA3 region showing pyramidal neurons with normal profile, pale nucleus and prominent nissl granules in the cytoplasm without any shrinkage (Fig 1A, 2A). In the Group II and III rat brain sections the hippocampus demonstrated major alteration in the neuronal profile of CA1 and CA3 regions, increase in the number of dead, darkly stained shrunken pyramidal cells with pyknotic nucleus, the number of normal pyramidal cell population was drastically less. (Fig 1B, 1C, 2B, 2C). The brain sections of ascorbic acid treated rats (Group IV and V) demonstrate decreased number of shrunken cells, damaged neurons in the CA1 and CA3 regions of hippocampus and the proportion of normal cell in the pyramidal region was comparatively higher than the mercury only groups (Fig 1D, 1E, 2D, 2E).

Figure 1: Sections of cellular layers of hippocampal CA1 region (H&E × 250)

Fig.1A represents Group I (control), the arrow indicates the prominent pyramidal cells. Fig. 1B represents Group II (HgCl2; 49.8mg/kg), arrow indicates the dead shrunken neurons with pyknotic nucleus. Fig. 1C represents Group III (HgCl2;

49.8mg/kg and distilled water) showing degenerating pyramidal cell (white arrow) and some surviving pyramidal neurons (yellow arrow). Fig. 1D and 1E represents Group IV and V (HgCl2; 49.8mg/kg and ascorbic acid; 595mg/kg and 1,190mg/kg treated), the arrow indicate pyramidal cells.

Figure 2: Sections of cellular layers of hippocampal CA3 region (H&E × 250)

Fig. 2A represents Group I (control), the arrow indicates the prominent pyramidal cells. Fig. 2B represents Group II (HgCl2; 49.8mg/kg), showing dead shrunken neurons (DSN) with pyknotic nucleus (white arrow). Fig. 2C represents Group III (HgCl2; 49.8mg/kg and distilled water) showing degenerating pyramidal cell (white arrow) and some surviving pyramidal neurons (yellow arrow). Fig. 2D and 2E represent Group IV and V (HgCl2; 49.8mg/kg and ascorbic acid; 595mg/kg and 1,190mg/kg treated) showing few dead neurons (white arrow) and numerous surviving pyramidal cells (yellow arrow).

Table 2: Number of Hippocampal Pyramidal cells counted

Groups Administration Hippocampus
(Pyramidal cells)
Mean ± SEM
(n)
GI Control 30.33 ± 0.88
GII (HgCl2 alone) 7.33 ± 0.33*
GIII (HgCl2 and Distilled H2O) 10.33 ± 1.45*
GIV (HgCl2 and Vit.C595mg/kg) 20.67 ± 1.20*cd
GV (HgCl2 and Vit.C1,190mg/kg) 26.00 ± 2.08*ab

n= number of cells counted. SEM:Standard Error of Mean. HgCl2: Mercuric Chloride. Vit. C: Vitamin C *p<0.05 indicates significant difference compared to Group I (Control).

*a indicates significant difference between Group V and Group II. *b indicates significant difference between Group V and Group III.

*c indicates significant difference between Group IV and Group II *d indicates significant difference between Group IV and Group III.

Table 3: Mean latencies for spatial learning and memory using Morris water maze test

End of Training Week 3 Week 6
Groups Administration Mean ± SEM Mean ± SEM Mean ± SEM
(s) (s) (s)
GI Control 3.19 ± 0.32 3.38 ± 0.51 2.55 ± 0.53
GII (HgCl2 alone) 3.59 ± 0.68 47.45 ± 8.72*
GIII (HgCl2 and Distilled H2O) 3.76 ± 0.63 47.53 ± 7.67* 17.66 ± 2.44*
GIV (HgCl2 and Vit.C595mg/kg) 3.50 ± 0.47 40.51 ± 8.78* 7.69 ± 1.71*d
GV (HgCl2 and Vit.C1,190mg/kg) 3.85 ± 0.51 40.67 ± 9.95* 3.35 ± 0.40*a

*p<0.05 indicates significant difference compared to Group I (Control). s = mean time in seconds.

SEM: Standard Error of Mean.

*a indicates significant difference between Group V and Group II.

*b indicates significant difference between Group V and Group III.

*d indicates significant difference between Group IV and Group III.

HgCl2: Mercuric Chloride. Vit. C: Vitamin C

DISCUSSION

Many heavy metals such as mercury, lead, cadmium, manganese, solvents and other organic compounds have the capacity to damage the nervous tissues (Farina et al., 2011; Ibegbu et al., 2014). The administration of mercuric chloride in Wistar rats have induced a progressive damage to the CA1 and CA3 pyramidal neurons of the rat hippocampus and have significantly reduced the percentage of surviving pyramidal neurons. These neurodegenerative changes could invariably impair the activities of the hippocampus in learning, memory formation, storage and retrieval of information (Sadeeq et al., 2013). The present study showed a significant increase (p>0.05) in the mean time taken by rats to locate the hidden platform in Morris water maze cognitive test for spatial learning and memory during the weeks of mercuric chloride administration. The outcome of this present study correlates with the above data resulting in permanent selective damage to the CA1 and CA3 regions of the hippocampus with retarded performance in the Morris water maze cognitive task.

Ascorbic acid has shown improvement in the hippocampus histology and enhanced cognitive functions in rats induce with mercury neurotoxicity. Apart from cognitive enhancing property ascorbic acid has on various disease conditions, several neurological disorders were experimentally proved (Ibegbu et al., 2014; Animoku et al., 2018; Ekanem et al., 2020). This ameliorative role of ascorbic acid in mercury induced neurotoxicity in Wistar rats may be due to its rich antioxidant resource it posses (Ibegbu et al., 2014) which might have controlled the free radical generated during learning impairment and prevented neuronal death or its active compound might have evoked an effective resistance shield against various other mechanism which operates the neurotoxicity cascade.

CONCLUSION

In conclusion, this study has given a viable data that

ascorbic acid a well known antioxidant could also protect one of the most vulnerable population of brain regions, the hippocampus against the deleterious effect of mercury and retained the hippocampus mediated memory functions. The core mechanism of ascorbic acid which works against the neurotoxicity cascade operated by mercury was not completely understood through this study. Hence, a future detailed investigation could explore the unknown potentiality of ascorbic acid (Vitamin C).

Conflict of Interest: None declared.

REFERENCES

  1. Agency for Toxic Substances and Disease Registry (ATSDR). (2011). Exposure to hazardous substances and reproductive health. American Family Physician 48(8):1441-1448.
  2. Animoku Abdulrazaq, Buraimoh A, Wilson Hamman, Augustine Ibegbu, Samuel B. Mesole, Uthman A. Yusuf, Joseph S. Maliki and Peter Akpulu (2018). Ameliorative effect of ascorbic acid (Vitamin C) on mercury induced temporal lobe damage in rats. Nigerian Journal of Neuroscience, Vol 9(1), Pg 9-15
  3. Brian G and Fred S. (1995). Distribution and effect of mercury. Mercury action news, vol 3:3.
  4. Booth, S. and Zeller, D. (2005). “Mercury, food webs, and marine mammals: implications of diet and climate change for human health,” Environmental Health Perspectives, vol. 113, no pp. 521-526.
  5. Burger J, Jeitne C, Gochfeld M. (2011). Locational differences in mercury and selenium levels in18 species of saltwater fish from New Jersey. Journal of Total Environmental Health A. 2011;74(13):863-74.
  6. Choi, M. D., Gao, X., Curhan, G., Xiang Gao, M. D. and

Nigerian Biomedical Science Journal Vol. 17 No 2 2020 43

The Role of Ascorbic acid on Mercury…

Gary Curhan, M. D. (2009).Vitamin C Intake and the Risk of Gout in Men. Archives of Internal Medicine. 169 (5): 502-507.

  1. Department for Environment Food and Rural Affairs (DEFRA) and Environment Agency (EA) (2002). Contaminants in soil: Collation of toxicological data and Intake values for Humans. Mercury. R&D Publications TOX 7
  2. Ekanem AU, Kudighe PU, Ekemini IJ and Ofonime SE (2020). Assessment of neuroprotective effedt of ascorbic acid against manganese dichloride induced cerebellar damage in female Wistar rats. International Research Journal of Medicine and Biomedical Sciences, vol. 1 pg 7-12.
  3. European Commission. (2005). 101 Communication from the Commission to the Council and the European Parliament on Community Strategy Concerning Mercury Extended Impact Assessment 101:20 final 28, p. 12.
  4. Farina M, Rocha JB, Aschner M. (2011). Mechanisms of methylmercury-induced neurotoxicity: Evidence from experimental studies. Journal of life sciences (89) Pg 555-563
  5. Gemma C, Bachstetter AD, Bickford PC. (2010). Neuron-Microglia dialogue and hippocampal neurogenesis in the aged brain. Aging Dis. 1(3)232-244
  6. Grant LD and Lipman M. (2009). Human exposure and their effect. Environmental toxicant; 3rded 108-112.
  7. Hemila, H. and Louhiala, P. (2007). Vitamin C for preventing and treating pneumonia.Cochrane Database System Rev (1).
  8. Ibegbu AO, Animoku AA, Ayuba M, Brosu D, Adamu SA, Akpulu P, Hamman WO, Umana UE Musa SA. (2013). Effect of Ascorbic Acid on Mercuric Chloride-Induced Changes on the Cerebral Cortex of Wistar Rats. African Journal of Cellular Pathology, Vol.1 Pg23-29.
  9. Ibegbu AO, Animoku AA, Ayuba M, Brosu D, Adamu SA, Akpulu P, Hamman,WO, Umana UE, Musa SA. (2014). Effect of Ascorbic Acid on Mercuric Chloride-Induced Changes on the Histomorphology of the Cerebellum of Wistar Rats. African Journal of Cellular Pathology, Vol.3 Pg9-15.
  10. Liu, L., Jiong, D., Charles, M., Junying, G., Gang., Hu, M. and Xiao, K. (2011). Pretraining affects Morris water maze performance with different patterns between control and ovariectomized plus d-galactose-injected mice. Behavioral Brain Research 217:1, 244-247
  11. Mark, C., David, S. and Touretzky, A. (2007). Context Learning in the Rodent Hippocampus. Neural Computation 19:12, 3173-3215.
  12. Material Safety Data Sheet (MSDS). (2008). Safety data for Mercuric Chloride Physical and Chemical Properties. Janssen Pharmaceutical 3a. 2440 Geel, Belgium.
  13. Maurice, V. and James, A. F. (1972). The nutritional and metabolic diseases of the cerebellum. Clinical and pathological aspects. In the cerebellum in health and diseases, edited by: William S. F. and William D. W. Adam Hilger, London. p. 412- 449.
  14. Morris, R. G. (1981). Spatial Localization Does Not Require the Presence of Local Cues. Learning and Motivation. 12, 239-260.
  15. Onyeike EN, Obbuja SI, Nwinuka NM. (2002). Inorganic ion levels of soils and streams in some area of Ogoni land, Nigeria as affected by crude oil spillage. Journal. Environmental. Monitoring. Assessments. 73:191-205.
  16. Padayatty SJ, Katz A, Wang Y, Eck P, Kwon O, Lee J, Chen S, Corpe C. (2003). Vitamin C as an antioxidant: evaluation of its role in disease prevention. Journal of the American College of Nutrition, 22 (1): 18-35.
  17. Sadeeq AA, Ibegbu AO, Taura MG, Timbuak JA, Adamu LH, Kwanashie HO. (2013). Studies on the effects of mercury exposure on spatial learning and memory of adult wistar rats. International Journal of Pharmaceutical Science Invention. Volume 2 Issue 12. PP.12-16.
  18. Savini, I., Rossi, A., Pierro, C., Avigliano, L. and Catani, M. V. (2007). SVCT1 and SVCT2: key proteins for vitamin C uptake. Amino Acids, 34 (3): 347-55.
  19. UK Food Standards Agency. (2007). Vitamin C risk assessment http://www.food.gov.uk/multimedia/pdfs /evm_c.pdf.
  20. Valko M, Morris H, Cronim MT.(2005). Metals, toxicity and oxidative stress. Curr Med Chem. 12(10):1161-208
  21. Wade MG, Parent S, Finnson KJ, Foster W, Younglai EJ, Mc Mahon A, Cyr DG, Hughes C. (2002). Thyroid toxicity due to subchronic exposure to a complex mixture of 16 organo-chlorines, lead and cadmium. Toxicol Sciences.67 (2): 207- 218.
  22. Wilson, JX. (2005). Regulation of vitamin C transport. Annual. Revolution of Nutrition, 25:105-125.
  23. World Health Organization. (2001). Area of work: nutrition. Progress report 2000 (PDF). Archived from the original.
  24. World Health Organisation (WHO). (2005). Mercury Training Module. WHO Training package for Health Sector. Geneva, World Health Organization.
  25. World Health Organisation (WHO). (2007). Preventing disease through healthy environments; exposure to mercury, a major public health concern. Geneva, Switzerland.
  26. Zhang, M.Q. and Deng, R.W. (2002). Evaluation of mercury emissions to the atmosphere from coal combustion, China. Am biosphere 31 (6), 482-484.


Glycated Haemoglobin Concentration correlation to Fasting Blood Glucose values of pregnant women in Port Harcourt Metropolis, Rivers State, Nigeria

Asawalam, A.V., Diorgu, F.C.

Department of Midwifery/Child Health, Africa Centre of Excellence for Public Health and Toxicological Research

Alabere, I.D.

Department of Preventive and Social Medicine, University of Port Harcourt

All Correspondences to: Asawalam, A.V Email: asawalamakuchi@yahoo.com

ABSTRACT

Background and Aim: Gestational diabetes mellitus (GDM) is hyperglycaemia in pregnancy. Although HbA1c may be a better screening tool for GDM, its availability and accessibility is poor due to high cost compared to fasting blood glucose. The aim of this study was to determine the HbA1c concentration correlation to FBG values of pregnant women attending antenatal clinic in selected private hospitals in Port-Harcourt Metropolis, Rivers State, Nigeria. Materials and Methods: A Laboratory based descriptive cross-sectional study design was used with participants recruited using a convenience sampling technique. An ichroma machine for analysis of HbA1c data and a photocolorimetre for analysis of FBG data were used. Descriptive and inferential statistical were performed and significance level was set at 0.05. Results: A total of 113 pregnant women were studied with a mean age of 32.38 ± 5.40 years. Prevalence of GDM with HbA1c was 5.3% while FBG was 6.2%. Socio-demographic (Age) and obstetric factors (Gravidity and Parity) were identified as risk factors for GDM. There was a strong linear positive correlation between participant’s HbA1c concentration and FBG values (r=0.775). Conclusion and Recommendations: The HbA1c and FBG levels of participants in this study were found to be strongly correlated. It is therefore recommended that in facilities where HbA1c is not available, the regression equation formulated in this study can be used for inter-conversion of values between HbA1c and FBG. Additionally, there is the need to closely monitor the blood glucose level of

pregnant women who are 40 years, multi-gravida and multi-para.

Keywords: Glycated haemoglobin, fasting blood glucose, pregnant women, Port-Harcourt.

INTRODUCTION

Gestational Diabetes Mellitus (GDM) is one of the leading causes of maternal and infant mortality and morbidity (Ma et al., 2013). GDM is a condition in which a woman without diabetes develops high blood sugar levels during pregnancy which is associated with adverse obstetric and perinatal outcomes (Yu et al., 2014). GDM has become a public health burden and pregnant women with GDM are at a risk of developing gestational hypertension, pre-eclampsia, and having operative deliveries. Some babies born to GDM women are at risk of being big and may suffer some congenital anomalies, develop neonatal hyperglycaemia and even Type 2 DM later in life (Yu et al., 2014). Globally, about 15% of pregnant women are affected with GDM, about 87% of these women are found in low and middle-income countries (Mahtab & Bhowmk, 2016). In Africa, the prevalence of GDM was 13.61% (Niroomand et al., 2019). Studies in Nigeria showed an overall prevalence of gestational diabetes as 13.4% among pregnant women with unidentified risk factors (Nwaokoro et al., 2014)

while in Rivers State, the prevalence of gestational and overt diabetes was 21.2% and 2.4% respectively (Abbey & Kasso, 2018).

Fasting Blood Glucose (FBG) is a predictive index for GDM, It is easy to administer, inexpensive and reproducible (Mendez-Figueroa et al., 2014). Studies have shown that FBG can be used to predict risk for GDM (Hinkle et al., 2018). However, the value of FBG for GDM screening remains uncertain. Glycated haemoglobin (HbA1c) is a form of haemoglobin that is chemically linked to a sugar and can maintain in the whole lifespan (120 days) of red blood cells, and shows the average level of blood glucose for the past three months (Yu et al., 2014). HbA1c has also been widely accepted as an indicator used to evaluate the blood glucose control in diabetes mellitus (DM) patients (Al-Rowaily et al., 2010) However, evidence on the application of HbA1c in the screening/diagnosis of GDM is very poor (Yu et al., 2014). HbA1c and FBG are screening tools for detection of GDM. FBG is cheap, available and it is faced with issues pertaining long fasting for at least 8 hours and shows the level of blood glucose at the time of testing, HbA1c does not entail fasting and shows the average level of glucose in blood for the past three months which is an added advantage over FBG tests, but its availability and accessibility is low due to high cost. The aim of this study was thus to determine the glycated haemoglobin concentration correlation in relation to fasting blood glucose values among pregnant women attending ANC in private hospitals. This was necessary in order to bridge the knowledge gap in this field of study, to identify more convenient method of GDM detection, as well as provide an alternative for addressing issues related to unavailability inaccessibility of HbA1c testing which is essential for early glycaemic control.

MATERIALS AND METHODS

A laboratory based descriptive, cross sectional study design was employed for this study. The study was conducted among 113 pregnant women, aged between 15 and 49 years attending the antenatal clinics of four selected private hospitals in Port Harcourt Metropolis. Inclusion criteria for this study included all pregnant women attending ante-natal clinics in the selected four private hospitals, with no known history of diabetes mellitus as well as pregnant women who came for the ante-natal clinics fasting. Those with a known history of haemoglobinopathies e.g. anaemia where excluded from the study. A sample size of 113 was calculated using the formula n = Zα2pq/d2 (Lwanga & Lemeshow, 1991). Convenience sampling method was employed in the selection of participants for this study. Participants’ socio-demographic (age) and obstetric characteristics (Gravidity and Parity) were collected after due permission had been sought from the authorities. The selected hospitals were visited earlier and the study participants informed about the research and encouraged them to come fasting for their next antenatal care clinic (ANC). Blood samples were collected from consenting participants between 7:00 am and 9:00 am while they were still in the fasting state in the phlebotomy room of the laboratory. A 5ml syringe and needle were used to withdraw blood from the median cubital vein in the cubital fossa and was dispensed into coded sample bottles. Two mls of the blood sample was dispensed into fluoride oxalate tube for analysis of fasting blood glucose using the enzymatic approach (Wiener, 2000). Another 2mls was dispensed into an ethylene diamine tetra-acetic acid (EDTA) tube for analysis of glycated haemoglobin using the fluorescence immunoassay method (Gupta et al., 2017). Collected blood samples were pooled and stored in a sample box carrier (Synlab) at a temperature of 2 to 80c and transported to the reference laboratory for analysis. Ethical approval to carry out this study was obtained from the Research and Ethics Committee of the University of Port Harcourt. Permission was also sought from the Medical Directors of the selected hospitals. Informed consent was obtained from subjects and blood samples were collected in the phlebotomy room of the laboratories to ensure privacy. No harm came to any of the study participants by ensuring infection control practices. Sample bottles were coded and no unique identifier of the participants was collected in order to ensure confidentiality of their laboratory results. Collected data was coded and entered into the Microsoft Excel software (version 2010) and then exported to the Statistical Package for Social Sciences (SPSS version 20.0, IBM, Armonk, New York, United States of America). FBG & HbA1C values were tested for normality using the Anderson-Darling (AD) test, Jarque-Bera (JB) test and Shapiro-Wilk (W) test. Descriptive statistical operations were performed and categorical data were presented as frequencies and percentages while continuous data were presented as means and standard deviations. Inferential statistical analysis involved the use of the chi-square (x2) test for comparison of proportions, student t-test for difference in two means and analysis of variance (ANOVA) for difference in three means. Bivariate logistic regression was used to assess odds of association in selected variables and Pearson’s correlation coefficient in assessing association for two continuous variables. A p-value of ≤ 0.05 was considered statistically significant. GDM diagnosis was made using the World Health Organization’s diagnostic criteria. GDM was present if fasting blood glucose was ≥ 7.0 mmol/L and HbA1c ≥ 6.5%

RESULTS

Socio-Demographic and obstetric characteristics of participants.

In this study, those within the age range 30-39 years had the highest proportion of 65.49%, followed by those within the age range 20-29 years, with 27.43%. The least were those 40-49 years with 7.08%. Participants’ mean age was 32.38

Table 1: Socio-demographic (age) and Obstetric factors (gravidity and parity) of participants

Characteristics Frequency (n=113) Percentage (%)
Age (Years) 31 27.43
20-29
30-39 74 65.49
40-49 8 7.08
Mean age: 32.38 ± 5.40 years
Gravidity 26 23.01
1
51 45.13
2
3+ 36 31.86
Mean gravidity: 2.30 ± 1.11
Parity 35 30.97
0 43 38.05
1 15 13.27
2
20 17.71
3+

Mean parity: 1.22 ± 1.16

  • 5.40 years. The mean number of pregnancies (gravidity) of participants was 2.30 ± 1.11, with 51 (45.13%) women having 2 pregnancies followed by 36 women that have had 3 or more pregnancies (31.86%) in the past. The least were those with only one pregnancy (23.01%). Furthermore, mean number of deliveries (parity) of participants was 1.22
  • 1.16, with 38.05% of the women having only one delivery, followed by 30.97% for those with no delivery. Those with 2 children and 3 or more were 13.27% and 17.71% respectively. This data is shown in Table 1.

Prevalence of GDM

Table 2 shows that only 6 (5.31%) of the pregnant women had HbA1c levels of ≥ 6.5% indicating GDM while 107 (94.69%) of them had values within the range of 4 – 6.4% which is non-GDM. The table additionally shows that mean glycated haemoglobin of participants was 4.92 ± 0.66%. The prevalence of GDM from HbA1c parameters was therefore found to be 5.3%. Also, the mean Fasting Blood Glucose level of the participants was 4.78 ± 0.77mmol/L, with 106 (93.81%) of the women being Non-GDM, and 7 (6.19%) women having FBG level ≥ 7.0 mmol/L, thus giving a prevalence of Gestational Diabetes Mellitus of 6.2%.

Table 2: Glycated Haemoglobin (HbA1c) and Fasting Blood Glucose (FBG) values of study participants

Variable GDM Non GDM Mean
(6.5% or (4 – 6.4% or
7.0mmol/L) <7.0mmol/L)
Freq (%) Freq (%)
HBA1C 6 (5.31) 107 (94.69) 4.92 ± 0.66%
FBG 7 (6.19) 106 (93.81) 4.78 ± 0.77mmol/L

Association between FBG and HbA1c values

A statistically significant association was found to exist between the participants’ glycated haemoglobin (HbA1c) and fasting blood glucose (FBG) values (p=0.000). From Table 3, 106 (93.81%) of the pregnant women were classified as non-GDM by both HbA1c and FBG. Similarly, 6 (5.31%) women were categorized as GDM cases by the two screening tools with only one (0.88%) woman that was classified as GDM by FBG which the HbA1c classified as non-GDM. Also, a statistically significant strong linear positive correlation was found between the participants’ glycated haemoglobin (HbA1c) and fasting blood glucose (FBG) values. (r=0.775; p=0.001).

Table 3: Association between FBG and HbA1c among participants

FBG

NON-GDM GDM Total df Fisher’s
(<7.0mmol/L) (≥7.0mmol/L p-value
Freq (%) Freq (%)
HbA1c 106 (99.07) 1(0.93) 107(100.0) 1 0.000*
NON-GDM (4-6.4%)
GDM (≥6.5%) 0 (0.00) 6 (100) 6 (100.0)
Total 106 (93.81) 7 (6.19) 113 (100.0)
Pearson’s correlation coefficient (r) 95% CI p-value
HbA1c vs. FBG 0.775 0.76-0.90 0.001

Formulating a regression equation.

Assessment of the FBG & HbA1C levels for normality using the Anderson-Darling (AD) test, Jarque-Bera (JB) test and Shapiro-Wilk (W) test revealed a significant ( p = ? 0 . 0 5 ) n o r m a l

distribution with values 5.442, 118.8 and 0.835 respectively for FBG, while for HbA1C the values were 3.935, 83.42 and 0.866 respectively. The assumption for regression analysis is not violated since the normality test is significant; it was therefore appropriate to determine the predictive relationship between FBG and HbA1C. From Fig 1, “Y” the dependent variable was the HbA1c levels while the independent variable was “X” which is FBG; “a” the

intercept on the “Y-axis was 1.716, while the slope “b” was 0.67. The regression equation to predict the value of HbA1c from a given value of FBG is therefore: Y = 1.716 + 0.670X.

Association between socio-demographic and obstetric factors with GDM

Assessment of the associations with the occurrence of GDM diagnosed using Glycated Haemoglobin (HbA1c) showed a statistically significant relationship between age and GDM. The proportion of participants with GDM increased with increasing age: 2.86% for those who are ?39 years compared to 37.5% for those that are ?40 years of age (p = 0.000). Additionally, logistic regression shows that participants who are ?40 years are about 20.4 times more likely to have GDM compared to those who are younger (OR: 20.4; 95% CI: 0.01-0.49). Also a statistically significant association was found to exist between the number of pregnancies and the GDM status of the participants diagnosed using their HbA1c levels. The proportion of pregnant women with HbA1c level of ?6.5%

increased with increasing number of pregnancies: 1.3% for those with ?2 pregnancies compared to 13.89% for those with ?3 pregnancies (p = 0.005). Logistic regression shows that participants with ?3 pregnancies are about 12 times more likely to have HBA1c value of ?6.5% compared with those with ?2 pregnancies (OR: 12.26; 95% CI: 1.27-587.13). Finally, a statistically significant relationship was found to exist between parity and HbA1c levels. Those who have had one or less previous delivery had a lower proportion for GDM (1.28%) compared to those with two or more previous deliveries (14.29%) and the difference was significant (p = 0.02). Logistic regression shows that those with two or more previous deliveries are almost 13 times more likely to have GDM compared to those with one or no previous delivery (OR:12.83; 95% CI: 1.43-114.45). These are shown on Table 4.

Table 4: Association between socio-demographic and obstetric factors with GDM diagnosed using Glycated Haemoglobin (HbA1c)

HbA1c Total df x2 OR p-value
(95% CI)
GDM NON-GDM
(6.5%) (4 – 6.4%)
Freq (%) Freq (%)
Age 20.40R
≤39 3 (2.86) 102 (97.14) 105(100) 1 17.744 0.000*
≥40 3 (37.50) 5 (62.50) 8 (100) (0.01-0.49)
Total 6 (5.31) 107 (94.69) 113(100)
Number of
Pregnancies
≤2 1 (1.30) 76 (98.70) 77(100.0) 1 7.734 12.26 0.005*
≥3 5 (13.89) 31 (86.11) 36(100.0) (1.27-587.13)
Total 6(5.31) 107(94.69) 113(100)
Parity
≤1 1 (1.28) 77 (98.72) 78(100.0) 1 5.74 12.83 0.02*
≥2 5 (14.29) 30 (85.71) 35(100.0) (1.43-114.45)
Total 6(5.31) 107(94.69) 113(100)

Assessment of the associations with the occurrence of GDM diagnosed using Fasting Blood Glucose (FBG) showed a statistically significant association between age and FBG level. The proportion of participants with GDM increased with increasing age; 3.81% for those who are ≤ 39 years of age compared with 37.50% for those who are ≥ 40 years of age (p=0.000). Also bivariate logistic regression shows that those who are ≥ 40 years of age are about 15 times at odds of having GDM compared to those who are younger (OR: 15.15; 95% CI: 0.01 – 0.60). Also, a statistically significant association was found between the number of pregnancies and the occurrence of GDM. Participants who have been pregnant three or more times have a higher proportion of GDM (16.67%) compared to those with two or less pregnancies (1.30%) with p = 0.002.

Logistic regression indicated that women who have had three or more pregnancies are about 15 times more likely to have FBG level of ≥ 7.0mmol/L compared to those with two or less number of pregnancies (OR: 15.20; 95% CI: 0.00 to 0.59). Finally, a statistically significant association was found to exist between parity and GDM using the FBG values. The table shows that the ante-natal women who are para ≥ 2 have a higher proportion of those with GDM (17.14%) compared to those who are para ≤1 (1.28%) and the difference is statistically significant (p=≤ 0.05). Logistic regression also shows that those who are para ≥ 2 are almost 16 times at odds of having GDM compared to those that are para ≤ 1(OR= 15.93; 95% CI: 0.00-0.57). This data is shown on Table 5.

Table 5: Association between socio-demographic and obstetric factors with GDM diagnosed using Fasting Blood Glucose (FBG)

HbA1c Total df x2 OR p-value
(95% CI)
GDM NON-GDM
(6.5%) (4 – 6.4%)
Freq (%) Freq (%)
Age 15.15R
≤39 4 (3.81) 101 (96.19) 105(100) 1 14.392 0.000*
≥40 3 (37.50) 5 (62.50) 8 (100) (0.01-0.60)
Total 7 (6.19) 106 (93.81) 113(100)
Number of
Pregnancies
≤2 1 (1.30) 76 (98.70) 77(100.0) 1 9.97 15.20 0.002*
≥3 6 (16.67) 30 (83.33) 36(100.0) (0.00-0.59)
Total 7 (6.19) 106(93.81) 113(100)
Parity
≤1 1 (1.28) 77 (98.72) 78(100.0) 1 7.90 15.93 0.005*
≥2 6 (17.14) 29 (82.86) 35(100.0) (0.00-0.57)
Total 7(6.19) 106(93.81) 113(100)

DISCUSSION

Gestational diabetes mellitus is a public health burden resulting in increased morbidity and mortality of both mother and offspring (Veeraswamy et al., 2012). This study showed that the prevalence of GDM using HbA1c was 5.3% and FBG was 6.2%. This implies that the prevalence of GDM among this population was low. This finding is similar to that reported by Odsaeter et al., (2016); Yadav et al., (2012) in India; which revealed the prevalence of GDM to be 7.2% and 7.1% respectively. The results from this study are however slightly higher than what was reported in the studies conducted by Ewenighi et al. (2013) in South-East Nigeria (4.8%) and Ogu et al. (2017) in South-South Nigeria (3.3%). In addition, a study conducted in Malaysia by Logakodie et al. (2017) gave a prevalence of 27.9%. and a study in South East Nigeria by Onyenekwe et al. (2019) using various criteria reported a prevalence of 38.0% using the IADPSG. These values are much higher than the findings from this study. The differences in the prevalence of GDM could be as a result in the usage of various diagnostic criteria. The situation in Nigeria is plagued with the same lack of definite consensus on criteria for diagnosis of GDM Onyenekwe et al. (2019). Also, it could be as a result of a large sample size (704) used by Logakodie et al., (2017) which enabled the identification of large number of pregnant women with GDM.

In this study, there was also strong positive correlation (0.775) between HbA1c and FBG which was statistically significant, implying that as the value of HbA1c increased so did the values of FBG. This therefore indicates that even though HbA1c may not replace FBG, it may still be a useful supportive tool to assess glycaemic status. This finding is similar to the results of the studies by Ahmed et

al. (2013) in Bangladesh and Ketema et al. (2015) in Ethiopia with moderate positive correlation coefficients of 0.507 and 0.61 respectively. The coefficient of determination (R2) value in this study’s analysis also showed that FBG explains 60.1% of the variation in HbA1C, indicating that the fitted model was appropriate. Based on the regression formula, Y = a + bX; where Y = dependent variable (HbA1C), X = independent variable (FBG); a = y-intercept =1.716; b = slope = 0.670; the regression equation was given as HbA1C = 1.716 + 0.670 (FBG). The independent variable, X (FBG) can thus be calculated using the formula: Y – a/b; which is FBG = HbA1c – 1.716/0.670.

The implication of this finding is that these equations could be utilized for inter-conversions between the levels of FBG and HbA1c thereby predicting their expected values in gestational diabetic patients. Applying the regression equation, as the HbA1c level increases, there will be a concomitant increase in fasting blood glucose level and vice versa. This finding is similar to findings in a study conducted by Khan et al. (2015) in Saudi Arabia where a regression equation was formulated for inter-conversion of HbA1c and FBS.

Regarding the association between certain factors and GDM (using HbA1c and FBG as diagnostic tools), it was found that a significant relationship existed between maternal age and GDM; implying that as maternal age increased, the risk of developing GDM also increased. Participants who were 40 years or more showed a 20 and 15 fold increase for GDM using HbA1c and FBG respectively compared to those with ages 39 years or younger. This is similar to findings from studies conducted by Afolayan and Tella (2009) in Yenagoa, Nigeria; Elmugadam et al., (2019) in Sudan; Al-Rowaily & Abolfotouh (2010) and Alfadhli et al. (2015) both in Saudi Arabia as well as Basha

36 Nigerian Biomedical Science Journal Vol. 17 No 2 2020

Glycated Haemoglobin Concentration…

et al. (2019) in Jordan. Also, a statistically significant association was observed between number of pregnancies and GDM. Participants that have had 3 or more pregnancies showed a 12 and 15 fold likelihood for developing GDM (using HbA1c and FBG respectively) compared to those that have had 2 pregnancies and less. This infers that an increase in the number of pregnancies (gravidity) increases the risk of having GDM using both screening tools. This is similar to findings by Elmugadam et al., (2019) in Sudan; Basha et al. (2019) in Jordan and Abualhamael et al. (2019) in Saudi Arabia. Similarly, a statistically significant association was found to exist between parity and GDM. Participants that have had 2 or more children showed a 13 and 16 fold likelihood for developing GDM (using HbA1c and FBG respectively) compared to those that have had 1 or no child. This suggests that with increasing number of children, there was also a concomitant increase in the risk of GDM using both FBG and HbA1c screening tools. This is similar to findings by Basha et al. (2019) in Jordan and Abu-Helja et al. (2017) in Oman; Abualhamael, et al. (2019) in Saudi Arabia.

CONCLUSION

Findings in this study undertaken to determine the glycated haemoglobin concentration correlation to fasting blood glucose values of pregnant women in Port Harcourt revealed a low prevalence of GDM and a positive strong correlation between HbA1c and FBG. Formulation of a regression equation for the prediction of HbA1c and FBG and vice versa was done and there was a significant relationship between socio-demographic and obstetric factors with GDM. The following recommendations were thus made:

  1. Screening all pregnant women who are aged 40 years and above, multiparous and multigravida for GDM using FBG test on booking; for prompt detection of GDM and early intervention to be put in place to prevent any negative pregnancy outcomes.

b. Clinicians who prefer HbA1c but cannot easily obtain it should adopt the regression equation formulated in this study to convert FBG values to HbA1c to meet their requirements for monitoring pregnant patients with diabetes mellitus.

c. Further research should be conducted on a larger sample size among diabetic mellitus patients in the Nigerian environment to enable the generalization and applicability of the findings from such studies.

REFERENCES

  1. Abbey, M., & Kasso, T. (2018). First trimester fasting blood glucose as a screening tool for diabetes mellitus in a teaching hospital setting in Nigeria. Asian Journal of Medicine and Health, 8(3),1-9.
  2. Abualhamael, S., Mosli, H., Baig, M., Noor, A. M., & Alshehri, F. M. (2019). Prevalence and Associated Risk Factors of Gestational Diabetes Mellitus at a University Hospital in Saudi Arabia. Pakistan Journal of Medical Sciences, 35(2), 325.
  3. Abu-Heija, A. T., Al-Bash, M. R., & Al-Kalbani, M. A. (2017). Effects of maternal age, parity and pre-pregnancy body mass index on the glucose challenge

test and gestational diabetes mellitus. Journal of Taibah University Medical Sciences, 12(4), 338-342.

  1. Afolayan, J. A., & Tella, S. A. (2009). Variation in Fasting in Blood Sugar Levels of Pregnant and non-pregnant women attending Federal Medical centre, Yenagoa, Bayelsa State, Nigeria. Sierra Leone Journal of Biomedical Research, 1(1), 44-49.
  2. Ahmed, A., Hoque, H., Alam, T., Ahmed, S., &Tasnim, N. (2013). HbA1C in Patients with Gestational Diabetes Mellitus. Chattagram Maa-O-Shishu Hospital Medical College Journal, 12(3), 11-15.
  3. Alfadhli, E., Osman, E., Basri, T., Mansuri, N., Youssef, M., Assaaedi, S., & Aljohani, B. (2015). Gestational diabetes among Saudi women: Prevalence, risk factors and pregnancy outcomes. Ann S a u d i M e d i c a l J o u r n a l , 3 5 ( 3 ) , 2 2 2 – 2 3 0 . https://doi.org/ 10.5144/0256-4947.2015.222
  4. Al-Rowaily, M., & Abolfotouh, M. (2010). Predictors of gestational diabetes mellitus in high-parity community in Saudi Arabia. EMHJ, 16 (6), 636-641.
  5. Anzaku, A. S., & Musa, J. (2013). Prevalence and associated risk factors for gestational diabetes in Jos, North-central, Nigeria. Archives of Gynecology and Obstetrics, 287(5), 859-863. DOI: 10.1007/s00404-012-2649-z
  6. Basha, A., Fram, K., Thekrallah, F., Irshaid, Z., Maswady, A. M., Obeidat, Z. N. (2018). Prevalence of gestational diabetes and contributing factors among pregnant Jordanian women attending Jordan University Hospital. International Journal of Diabetes in Developing Countries, 39(9), 132-138. https://doi.org/10.1007/s13410-018-0635-0
  7. Elmugadam, A. A., Ismail, M., & Eltom, A. (2019). Appraisal of A1c% level in healthy Sudanese pregnant women in reference to body mass index. International Journal of Reproduction, Contraception, Obstetrics and Gynecology, 8(5), 1835-1839. https://dx.doi. org/10.18203/2320-1770.ijrcog20191928
  8. Ewenighi, C. O., Nwanjo, H. U., Dimkpa, U., Onyeanusi, J. C., Nnatuanya, I. N., Onoh, L. U., Ezeugwu, U., Onoh, G., Ibeagi, O., & Adejumo, B. I. (2013). Prevalence of gestational diabetes mellitus; Risk factors among pregnant women in Abakaliki Metropolis, Ebonyi State Nigeria. National Journal of Integrated Research in Medicine, 4(1), 56-61.
  9. Gupta, S., Jain, U., & Chauhan, N. (2017) Laboratory Diagnosis of HbA1c: A Review. J Nanomed Res, 5(4): 00120. Doi: 10.15406/jnmr.2017.05.00120
  10. Hinkle, S. N., Tsai, M. Y., Rawal, S., Albert, P. S., & Zhang, C. (2018). HbA1c measured in the first trimester of pregnancy and the association with gestational diabetes. Journal of Scientific reports, 8(1), 1-8.

Nigerian Biomedical Science Journal Vol. 17 No 2 2020 37


  1. Ketema, E. B., & Kibret, K. T. (2015). Correlation of fasting and postprandial plasma glucose with HbA1c in assessing glycemic control; Systematic review and meta-analysis. Archives of Public Health, 73(1), 43.
  2. Khan, H. A., Sobki, S. H., & Alhomida, A. S. (2015). Regression analysis for testing association between fasting blood sugar and glycated hemoglobin in diabetic patients. Journal of Biomedical Research, 26(3).
  3. Logakodie, S., Azahadi, O., Fuziah, P., Norizzati, B., Tan, S., Zienna, Z., Norliza, M., Noraini, J., Hazlin, M., Noraliza, M. K., & Mimi, O. (2017). Gestational diabetes mellitus: The prevalence, associated factors and feto-maternal outcome of women attending antenatal care. Malaysian Family Physician, 12 (2), 9-17.
  4. Lwanga, S.K. & Lemeshow, S. (1991). Sample Size Determination in Health Studies: A Practical Manual. Geneva: World Health Organization. Available online at: http://www.who.int/iris/handle/10665/40062.
  5. Ma, R.C., Chan, J.C., Tam, W.H., Hanson, M.A., & Gluckman, P.D. (2013). Gestational diabetes, maternal obesity and the NCD burden. Clinical obstetrics and gynaecology, 56(3), 633-641.
  6. Mahtab, H., & Bhowmik, B. (2016). Gestational Diabetes Mellitus– Global and Bangladesh Perspectives. Austin J Endocrinol Diabetes, 3(2), 1041.
  7. Mendez-Figueroa, H., Daley, J., Lopez, V., & Coustan, D. (2014). Predicting the need for medical therapy in patients with mild gestational diabetes. American journal of perinatology, 31(02), 105-112.
  8. Niroomand, M., Afsar, J., Hosseinpanah, F., Afrakhteh, M., Farzaneh, F., & Serahati, S. (2019). Comparison of the International Association of Diabetes in Pregnancy Study Group Criteria with the Old American Diabetes Association Criteria for Diagnosis of Gestational Diabetes Mellitus. International Journal of Endocrinology and Metabolism, 17(4).

Asawalam, A.V.

  1. Nwaokoro, J. C., Emerole, C. O., Ibe, S. N. O., Amadi, A. N., & Dozie, I. N. S. (2014). Risk Factors Associated with Gestational Diabetes among Pregnant Women in Owerri Municipal Council, Southeastern Nigeria. Asian Journal of Medical Sciences, 5(1), 39-46.
  2. Odsaeter, I. H., Asberg, A., Vanky, E., Morkved, S., Stafne, S., Salvesen, K., Carlsen, S. (2016).

Haemoglobin A1c as screening for gestational diabetes mellitus in Nordic Caucasian women. D i a b e t o l M e t a b S y n d r o m e , 8 , 4 3 . https://doi.org/10.1186/s13098-016-0168-y

  1. Ogu, R.N., John, C. O., Maduka, O., & Chinenye, S.

(2017). Screening for gestational diabetes mellitus: Findings from a resource limited setting of Nigeria. British Journal of Medicine and Medical Research, 20(11), 1-8.

  1. Onyenekwe, B. M., Young, E. E., Nwatu, C. B., Okafor, C. I. Ugwueze, C. V., & Chukwu, S. N. (2019). Prevalence of gestational diabetes in South East Nigeria using the updated diagnostic guidelines. International Journal of Diabetes Metabolism, 25, 26-32. https://doi.org/10.1159/000500089
  2. Rajput, R., Yadav, Y., Rajput, M., & Nanda, S. (2012). Utility of HbA1c for diagnosis of gestational diabetes. Diabetes Research and Clinical Practice, 98, 104-107.
  3. Veeraswamy, S., Vijayam, B., Gupta, V. K., & Kapur, A. (2012). Gestational diabetes: The public health relevance and approach. Diabetes Research and Clinical Practice, 97(3), 350-358.
  4. Wiener Lab (2000). Glicemia enzimática. Enzymatic method for glucose determination in serum or plasma. Wiener Laboratorios S.A.I.C. Riobamba 2944 2000 – Rosario – Argentina. http://www.wiener-lab.com.ar
  5. Yu, H., Qi, X., & Wang, X. (2014). Application of glycated hemoglobin in the perinatal period. International Journal of Clinical and Experimental Medicine, 7(12), 4653–4659.


Nutritional Status Assessment of Children 0 to 12 Months in Ogbia, Bayelsa

Ephraim-Emmanuel, B.C., Oghe A.P., Ugwoke, E.I., Odikeme, E.D.

College of Health Technology, Otuogidi, Ogbia, Bayelsa State.

All Correspondences to: benchike2002@yahoo.com

ABSTRACT

Background and Aim: Malnutrition in children is a major public health problem especially among underdeveloped countries. It is associated with over 41% of annual deaths in children in developing countries and is said to be responsible for childhood morbidities. This study thus aimed at determining the nutritional status of children between 0 to 12 months of age in Ogbia Local Government Area (LGA) of Bayelsa state, Nigeria as well as their mothers’ knowledge regarding child nutrition. Materials and methods: A descriptive cross-sectional design was used in this study conducted in selected Primary Health Care centres located within the Ogbia LGA of Bayelsa state.. The population of the study was all children aged between 0 to 12 months and their parents/caregivers. Sample size was 158 mothers/guardians and their children who attended 4 consecutive immunization clinics. A structured questionnaire was used to elicit the knowledge of the mothers/guardians regarding proper nutrition for children. The nutritional status of the children was assessed using anthropometric indicators including wasting, stunting and weight assessments. Ethical clearance to carry out this research was gotten from the Project Research and Ethics Committee of the Bayelsa State College of Health Technology. Data was analyzed using the Statistical Package for Social Sciences (SPSS) version 20. Results: In all, majority of the children had normal weight for age values (92.4%), weight for height values (81.0%) and height for age values (63.3%). However, considering the height for age values; quite a number of children were found to be chronically malnourished 44 (27.8%) and severely stunted 14 (8.9%). 151 (95.6%) of their mothers/guardians had good knowledge regarding child nutrition. Conclusion: This study showed that malnutrition is a source of public health concern among children of between 0 and 12 months in Bayelsa State. It was recommended that health education on exclusive breastfeeding practices and other sources of affordable nutrition be made available to mothers.

Keywords: Nutritional status, Children, 0 to 12 months, Knowledge, Nutrition.

INTRODUCTION

Good nutrition for children especially in their formative years of life is important on both short and long term bases as it contributes to the physical, mental and emotional development of the children (Alamu, Atawodi, & Edokpayi, 2011; Dhungana, 2013; Roopadevi & Aravind, 2016). Optimal nutrition in children is achievable when there is adequate access to affordable, diverse, nutrient-rich food; appropriate maternal and child care, maternal education as well as availability of adequate health services and all components of a healthy environment (Akubugwo et al., 2014; Imo, Isiugo-Abanihe, & Chikezie, 2017; International Food Policy Research Institute, 2016).

Malnutrition in children is a major public health problem especially among underdeveloped countries (Chataut & Khanal, 2016; Zhang et al., 2011; Malmulwar et al., 2014). This pathological condition occurs in the event that a relative or absolute insufficiency or excess of one or more essential nutrients is present. It usually results from poor feeding practices such as inadequate breastfeeding, giving a child the wrong foods, lack of access to nutritious food, disease conditions such as malaria, frequent diarrhea among others (Adeola, Maccellina, Olatunji, Adedeji, & Olufemi, 2016; Chataut Khanal, 2016). Malnutrition could manifest as immediate and long-term consequences. On the immediate term, it could result in illness and disease, mortality as well as delayed mental and physical development. On the long term, malnutrition could result in impaired intellectual performance, impaired reproductive performance, reduced work capacity and an increased risk of chronic diseases (Alamu et al., 2011; Desalegne et al., 2015).

Malnutrition is associated with over 41% of annual deaths in children from 6 to 24 months of age in developing countries and is said to be responsible for childhood morbidities as well as more than a third of deaths due to preventable diseases (Akorede & Abiola, 2013; Adeola et al., 2016; Chataut & khanal, 2016; Desalegne et al., 2015; Olack et al., 2011). As at 2012, about 162 million under-five year children were stunted, 51 million were wasted and 99 million were underweight. Among these, 37% of all stunted children, 28% of all wasted children and 29% of all underweight children were reported to be in Africa (Ijarotimi, Adebiyi & Fatiregun, 2016). It remains a major public health issue in developing countries and its proper management is faced with a number of problems peculiar to the African continent (Awogbenja & Ugwuona, 2010; Imo et al., 2017). In Nigeria, reports have shown malnutrition prevalence among Nigerian children and its occurrence is associated with being in areas where basic essential needs of life such as food, shelter and clothing are often not within the reach of majority of the population (Adeola et al., 2016). Malnutrition has also been associated with poor maternal education which is a critical aspect in ensuring that mothers have the adequate knowledge of child nutritional needs and sources. (Babatunde, Olagunju, Fakayode & Sola-Ojo, 2011; International Food Policy Research Institute, 2016). Nigeria has also received low rankings with respect to indices of malnutrition and mortalities related with malnutrition. This is of public health importance as a result of the value placed on the lives of those affected. It is thus necessary to ensure the early detection of malnutrition in children in order to give way for relevant intervention strategies for its prompt reversal and management (Akorede & Abiola, 2013; Akubugwo, Okafor, Ezebuo, & Nwaka, 2016; Ijarotimi et al., 2016).

Considering that malnutrition is a public health burden in Nigeria and that relevant published evidence about its prevalence among children is lacking in Ogbia Local Government Area of Bayelsa State, it necessitated the conduct of this study. It is worthy of note that conducting this research would apart from contributing to the existing literature on nutrition among under-five aged children, it would also provide lacking evidence useful for purposes of nutritional surveillance. In addition, evidence provided can be useful in health planning and development by relevant private and public stakeholders especially as it relates with child care. This study, thus determined the nutritional status of children between 0 to 12 months of age in Ogbia Local Government Area (LGA) of Bayelsa state, Nigeria as well as their mothers’ knowledge regarding child nutrition.

MATERIALS AND METHODS

A descriptive cross-sectional design was used to assess the nutritional status of children aged between 0 and 12 months as well as the knowledge of their mothers on child nutrition. The study was carried out in selected Primary Health Care centres located within the Ogbia LGA of Bayelsa state, Nigeria where the major occupation is fishing and farming and in which the Ogbia dialect serves as the main spoken language. The demonstration clinic of the Bayelsa State College of Health Technology, Otuogidi which renders primary health care services to the catchment area of Otuogidi and the Primary Health Centre, Otuasega, served as the study sites. Activities usually carried out by these health centres include: Routine treatment of patients with minor health conditions, referral of severe health problems, routine immunization of women of childbearing age and children, family planning, etc. The population of the study was all children aged between 0 to 12 months attending the immunization clinic with their parents/caregivers at the selected Primary Health Care Centres. Sample size of 158 mothers/guardians and their children aged between 0 to 12 months who attended 4 consecutive immunization clinics at the selected Primary Health Care Centres was used for the conduct of this study. Data collection was done using a weighing scale and a measuring board which were used for anthropometric measurements. A structured questionnaire was also used to elicit the knowledge of the mothers/guardians regarding proper nutrition for children. The nutritional status of the children was assessed using anthropometric indicators including wasting, stunting and weight assessments. This was done by the measurement of weight for height (wasting), height for age (stunting) and weight for age (underweight) indicators among the children. Measurement errors due to parallax were avoided by ensuring the reading of the weight measurements at the required angulation. Deviation of the anthropometric indices from the standard value was considered to be evidence of malnutrition (Akubugwo et al., 2016). Ethical clearance to carry out this research was gotten from the Project Research and Ethics Committee of the Bayelsa State College of Health Technology. Permission to carry out this study was also gotten from the head of the Primary Health Care facilities. Informed consent was also gotten from the mothers before questionnaire distribution and the decision to complete the questionnaire was completely made voluntary. The questionnaires were then distributed to the parents/guardians who provided information on their knowledge of nutrition for children. Also, after getting written or verbal consent from the parent/guardian, all required anthropometric data was collected. Data was analyzed using the Statistical Package for Social Sciences (SPSS) version 20, was presented on tables and charts and expressed as frequencies and percentages.

RESULTS

In all, 158 mothers and their children were involved in this study. 52.5% of the children were male and 47.5% were female. Majority of the children were aged between 9 and 12 months (38.6%) as well as between 1 and 4 months (38.0%). Regarding their mothers, majority were farmers (30.4%), married (86.7%) and had received secondary school education (62.0%). The demographic data of our study participants are shown in Tables 1 and 2.

Table 1: Demographic data of children

Demographics Frequency Percentage (%)
1. Age (months)
<4 60 38.0
5-8 37 23.4
9-12 61 38.6
2. Sex
Male 83 52.5
Female 75 47.5


Demographics Frequency (%)
1. Education
None 5 3.2
Primary 7 4.4
Secondary 98 62.0
Tertiary 48 30.4
2. Occupation
Civil-servant 36 22.8
Trader 37 23.4
Company worker 3 1.9
Farmer 48 30.4
Others 34 21.5
3. Marital status
Married 137 86.7
Divorced 1 0.6
Single 18 11.4
Widowed 2 1.3

Regarding the nutritional status of the children, the weight for age, weight for height and height for age assessments were used. In all 3 assessments, majority of the children had normal weight for age values (92.4%), weight for height values (81.0%) and height for age values (63.3%). However, considering the height for age values; quite a number of children were found to be chronically malnourished 44 (27.8%) and severely stunted 14 (8.9%). The nutritional status of the children in this study is shown in Tables 3 to 5.

Table 3: Weight for Age assessment of the children

Weight for age assessment Frequency (%)
Normal 146 92.4
Underweight (-2 S.D.) 12 7.6
Severely underweight (-3 S.D.) 0 0.0

Table 4: Weight for Height assessment of the children

Weight for height assessment Frequency (%)
Severe acute malnutrition 1 0.6
(wasting) (-3 S.D.)
Moderate malnutrition 7 4.4
Normal 128 81.1
Overweight (+3 S.D.) 22 13.9
Table 5: Height for Age assessment of the children
Height for Age assessment Frequency (%)
Normal 100 63.3
Chronically malnourished (-2 S.D.) 44 27.8
Severely stunted (-3 S.D.) 14 8.9

Ephraim-Emmanuel, B.C.

Regarding the knowledge of nutrition among the mothers involved in this study, 151 (95.6%) of them had cumulative knowledge scores greater than the median score for knowledge (12.5) showing that majority of respondents had good knowledge regarding child nutrition. Only 7 (4.4%) of the respondents had a knowledge score below the median knowledge score. This is shown in Figure 1.

Figure 1: Knowledge of mothers about child nutrition

DISCUSSION

The results of this study revealed that malnutrition is prevalent in the study area manifesting mainly as stunting, being underweight as well as being overweight. The prevalence of stunting in this study corroborates findings of stunted growth among children in South-Western Nigeria (Akorede & Abiola, 2013; Amosu et al., 2011), South-Eastern Nigeria (Ezeama et al., 2015; Nwabeuze et al., 2015) and in Nigeria as whole (NDHS, 2013; NNHS, 2015). Studies conducted in the North-Western and North-Central regions of Nigeria also corroborated the present study findings but with reports of much higher prevalence rates of stunting (Adeola et al., 2016; Awogbenja & Ugwuona, 2010). This finding could have occurred as a result of prolonged episodes of improper nutrition for young infants, such as poor exclusive breastfeeding practices and inadequate complementary feeding practices especially during the first 2 years of life (Ijarotimi et al., 2016).

The prevalence values of wasting as well as being underweight in the present study were found to be low. Comparison with other findings however, showed higher prevalence values in South-Eastern Nigeria (Akubugwo et al., 2014; Ezeama et al., 2015), South-Western Nigeria (Akorede & Abiola, 2013; Amosu et al., 2011; Ijarotimi et al., 2016) and Northern Nigeria (Adeola et al., 2016; Awogbenja & Ugwuona, 2010) with malnutrition values being highest in the Northern regions. This agrees with the NDHS (2013) report, that wasting as a sign of malnutrition is higher in Northern Nigeria as compared with the South (NDHS, 2013). This may be due to failure to receive adequate nutrition as well as the levels of maternal education available in the different geo-political zones in Nigeria (Ajao et al., 2010; International Food Policy Research Institute, 2016). The prevalence of malnutrition manifesting as being underweight, is however similar to the findings of other studies conducted in Nigeria (Akorede & Abiola, 2013) and beyond the shores of Nigeria (Zhang et al., 2011). Conversely, in this study, the proportion of the infants that were overweight was found to be higher than the national prevalence (NNHS, 2015), the prevalence in South-Eastern Nigeria (Nwabeuze et al., 2015) as well as the prevalence in Northern Nigeria which coincidentally recorded the lowest values (NNHS, 2015). The implication of this finding is the likelihood of the prevalence of non-communicable diseases including diabetes, coronary heart disease amongst others. This is because being overweight in childhood has been found to be a risk factor for adult obesity which is associated these non-communicable diseases (WHO, 2010).

This study also revealed that the knowledge of child nutrition among the mothers/guardians involved in this study was very high, with about 95.6% of them having cumulative knowledge scores which were greater than the median score for knowledge in this study. This shows that majority of them had good knowledge regarding child nutrition. This view was however, not shared by Berihu, Abera, Berhe & Kidanu, (2013) who reported moderate and slight knowledge levels in their study. This finding made in the present study, could possibly be attributed to the level of education which most of the respondents had received. Maternal education is an asset for a child’s proper growth and nutrition (Lawal & Samuel, 2010). Poor maternal education has been significantly associated with malnutrition in children (Babatunde, Olagunju, Fakayode Sola-Ojo, 2011). Maternal education has been identified to be critically important for child health, nutrition, growth, and development (International Food Policy Research Institute, 2016). It is also important to note that even though the mothers/guardians knew what to do to provide adequate nutrition, the unavailability of resources to provide the needed nutrition to the children could also be a factor that could inhibit provision of proper nutrition to the children (Imo et al., 2017; Ndukwu, Egbuonu, Ulasi & Ebenebe, 2013).

Limitation

In this study, the inability to relate the mothers’/guardians’ demographics and the nutritional status of their children did not provide the opportunity to assess if demographic factors played a role in the occurrence of malnutrition among the children.

Conclusion

This study has shown that malnutrition remains a source of public health concern among children of between 0 and 12 months in Bayelsa State. Most of the mothers/Guardians of these children however had good knowledge of child nutrition. It was however recommended that health education on exclusive breastfeeding practices and other sources of affordable nutrition be made available to mothers. Food preparation demonstration should also be strengthened at the primary health level of care.

REFERENCES

  1. Adeola, A., Macellina, Y. I., Olatunji, A., Adedeji, O., & Olufemi, A. (2016). Assessment of Childhood Malnutrition Status : Finding from a Health and Demographic Surveillance System. International Journal of Clinical Nutrition, 4(1),7 – 11 . DOI:10.12691/ijcn-4-1-2
  2. Ajao, K. O., Ojofeitimi, E. O., Adebayo, A. A., Fetusi, A. O., & Afolabi, O. T. (2010). Influence of Family Size, Household Food Security Status, and Child Care Practices on the Nutritional status of Under – five Children in Ile – Ife, Nigeria. African Journal of Reproductive Health, 14(4),123
  3. Akorede, Q. T., & Abiola, O. M. (2013). Assessment of Nutritional Status of Under Five Children in Akure South Local Government, Ondo State, Nigeria. I J R R A S , 1 4 ( 3 ) . R e t r i e v e d f r o m http://www.arpapress.com/volumes/vol14issue3 /IJRRAS_14_3_24.pdf
  1. Akubugwo, E. I., Okafor, I. N., Ezebuo, F. C., & Nwaka, A. C. (2014). Nutritional Status of Preschool Aged Children in Anambra State, Nigeria. Journal of Pharmacy and Biological Sciences, 9(2), 01-08. DOI: 10.9790/3008-09270108
  2. Alamu, T. O., Atawodi, S. E., & Edokpayi, J. N. (2011). Nutritional Status of Infants Attending Infant Welfare Clinic of Amadu Bello University, Health Service Samaru. Advances in Applied Science R e s e a r c h , 2 ( 4 ) , 5 8 – 6 4 . R e t r i e v e d f r o m http://www.pelagiaresearch.com
  1. Amosu, A. M., Degun, A. M., Atulomah, N. O. S., & Olanrewju. (2011). A Study on the Nutritional Status of Under-5 Children of Low-Income Earners in a South-Western Nigerian Community. Current Research Journal of Biological Sciences, 3(6), 578-585. ISSN: 2041-0778
  2. Awogbenja, M. D., & Ugwuona, F. U. (2010). Feeding Practices and Nutritional Status of Under-five Children in Nasarawa State, Nigeria. Production Agriculture and Technology, 6(1),23-35. ISSN: 0794-5213
  3. Babatunde, R.O., Olagunju, F.I., Fakayode, S.B. & Sola-Ojo, F.E. (2011). Prevalence and Determinants of Malnutrition among Under-five Children of Farming Households in Kwara State, Nigeria. Journal o f A g r i c u l t u r a l S c i e n c e , 3 ( 3 ) , 1 7 3 – 1 8 1 . DOI:10.5539/jas.v3n3p173
  4. Berihu, A., Abera, G.B., Berhe, H. & Kidanu, K. (2013). Mother’s Knowledge on Nutritional Requirement of Infant and Young Child Feeding in Mekelle, Ethiopia, Cross Sectional Study. Global Journal of Medical Research Interdisciplinary, 13(6), 13-24.
  5. Chataut, j., & Khanal, K. (2016). Assessment of the Nutritional Status of children Under Five years of age in rural Napalm. Kathmandu Univ Med J, 14(53),73-77.
  6. Desalegne, A., Ayenew, N., Baye, T., Birtukan, A., & Birchenu, A. (2015). Prevalence of Undernutrition and its Associated Factors among School Children below five years of Age in Bure Town, west Gojjam zone, Amhara National Regional State, Northwest Ethopia. Advances in Public Health, (8). Retrieved from http://dx.dio.org/10.1155/7145708
  1. Dhungana, G. P. (2013). Nutritional Status of Under 5 Children and Associated Factors in Kunchha Village Development Committee. Journal of Chitwan Medical College, 3(6),38-42. E-ISSN: 2091-2889, ISSN: 2091-2412
  2. Ezeama, N. N., Adogu, P. O. U., Ibeh, C. C., & Adinma, E. D. (2015). Comparative Analysis of Nutritional Status of Under Five Children and their Mother in Rural Nigeria. European Journal of Nutrition and Food Safety, 5(3), 190-201. DOI:10.9734/EJNFS/2015/17392
  3. Ijarotimi, I. T., Adebiyi, O. A., & Fatiregun, A. (2016). Urban-Rural Disparities and Determinants of Nutritional Status of Under Five Children : an Example of Akinyele Local Government Area, Ibadan. International Journal of TROPICAL D I S E A S E & H e a l t h , 1 6 ( 1 ) , 1 – 1 1 . DOI:10.9734/IJTDH/2016/25292
  4. Imo, C. K., Isiugo-Abanihe, U. C., & Chikezie, D. C. (2017). Socioeconomic Determinants of Under-five Children Health Outcome among Child bearing Mothers in Abia State, Nigeria. International Journal of Sociology and Anthropology, 9(2),17-27. DOI:10.5897/IJSA2016.0678
  5. International Food Policy Research Institute. (2016). Global Nutrition Report 2016: From Promise to Impact: Ending Malnutrition by 2030. Washington, DC.
  6. Malmulwar, M. S., Rathod, H. K., Jethani, S., Dhone, A., Bakshi, T., Lanjewar, B., … Bhawalker, J. S. (2014). Nutritional Status of Under – five Children in Urban Slums of Pune. International Journal of Medicine and Public Health, 4(3), 247-252. DOI: 10.4103/2230-8598.137710.
  7. National Nutrition and Health Survey. (2015). Report on the Nutrition and Health Situation of Nigeria. National bureau of Statistics Main Report, Abuja Nigeria.
  8. Ndukwu, C.I., Egbuonu, I., Ulasi, T.O. & Ebenebe, J.C. (2013). Determinants of undernutrition among primary school children residing in slum areas of a Nigerian city. Nigerian Journal of Clinical Practice, 16(2), 178-183.
  9. Nigeria Demographic and Health Survey. (2013). National Population Commission. Federal Republic of Nigeria, Abuja, Nigeria.
  10. Nwabueze, A. S., Ilika, A., Azuike., E. C., Nwabueze, N. C., Obi, K. M., Onebunne, M. E., … Azuike, E. D. (2015). Assessment of Nutritional status among Primary School Pupil in Rural and Urban Areas of Anambra State. European Journal of Preventive M e d i c i n e , 2 ( 2 ) , 3 4 – 3 8 . D O I : 10.11648/J.ejpm.20150302.14
  1. Lawal, B.O. & Samuel, F.O. (2010). Determinants of Nutritional Status of Children in Farming Households in Oyo State, Nigeria. African Journal of Food Agriculture, Nutrition and Development, 10(10), 4235-4253.
  2. Olack, B., Burke, H., Cosmas, L., Bamrah, S., Dooling, K., Feikin, D. R., … Breiman, R. F. (2011). Nutritional Status of Under-five Children Living in an Informal Urban Settlement in Nairobi, Kenya. International Centre for Diarrhoeal Disease Research, Bangladesh, 29(4),357-363. ISSN: 1606-0997.
  3. Roopadevi, V., & Aravind, K. (2016). “Nutritional Status Assessment of Under five Children in Urban field practice area of Mysore”. Journal of Preventive Medicine and Holistic Health, 2(1),1-3. DOI: 5958/2454-6712.2016.00001.8
  4. World Health Organization. (2010). Nutrition Landscape Information System: Country Profile Indicators Interpretation Guide. Geneva.
  5. Zhang, J., Shi, J., Himes, J. H., Du, Y., Yang, S., Shi, S., & Zhang, J. (2011). Undernutrition Status of Children Under 5 years in Chinese rural areas – Data from the National Child Growth Standard Survey. Asia Pac J Clin Nutr, 20(4), 584-59


Evaluation of Haemo-rheological Variability of Haemoglobin Genotypes in Descent of Rumuche Community, Emohua Local Government Area, Rivers State, Nigeria.

Serekara Gideon Christian, Ransom Baribefii Jacob; Moyosore Ruth Adedeji

Department of Medical Laboratory Science, Faculty of Science, Rivers State University, Nkpolu-Oroworukwo.

P.M.B. 5080, Port-Harcourt, Rivers State, Nigeria.

All Correspondences to: Serekara Gideon Christian E-mail: serekara.christian1@ust.edu.ng

ABSTRACT

The study aimed at evaluating the variability in some haemo-rheological parameters of individuals having different haemoglobin genotypes in Rumuche community, Emohua Local Government Area of Rivers state. A cross-sectional and comparative study design was applied. A total of eighty-seven subjects (sixty-nine AA and eighteen AS haemoglobin genotypes) aged between 20 – 90 years were recruited. Samples collected were analyzed for packed cell volume, erythrocyte sedimentation rate, haemoglobin and fibrinogen concentration using standard methods. Results for haemoglobin genotypes reveals that sixty-nine subjects were haeamoglobin AA (79.31 %), eighteen subjects were haemoglobin AS (20.69 %), no haemoglobin SS genotype was identified among the subjects. Also, the result showed a significant difference in haemoglobin concentration when haemoglobin AA were compared to AS genotypes (14.68 ± 2.600g/dl vs 12.76 ± 2.931g/dl; p = 0.0450). Packed cell volume, erythrocyte sedimentation rate and fibrinogen concentration showed no statistical difference despite variations upon comparison of haemoglobin AA and haemoglobin AS. Based on gender, the variations observed were not statistically significant in all parameters at p < 0.05. The study revealed a significant increase in haemoglobin concentration in favour of individuals with haemoglobin AA genotype. Therefore, a directly proportional difference in the blood viscosity of the different haemoglobin genotypes was observed and this can be a useful diagnostic tool alongside fibrinogen concentration and packed cell volume for predicting the occurrence of some diseases such as atherosclerosis, thrombotic disorders, cardiovascular diseases or haemorrhagic disorders. No variation was observed in packed cell volume, erythrocyte sedimentation rate, and fibrinogen.

Keywords: Haemoglobin Genotype; Haemo-rheological; Packed Cell Volume; Erythrocyte Sedimentation Rate; Fibrinogen; Rumuche Community; Emohua.

INTRODUCTION

Rumuche is one of the communities of Emohua Local Government Area, which was part of the Ikwerre ethnic group of  Rivers  State.  The community has an estimated population of about 5,000 persons as at 2016 [1, 2]. The indigenes of Rumuche are majorly farmers. Haemo-rheology consist of two main words namely,  “haemo”  which means blood and “rheology” which means the science of how blood is being deformed and how it flows. Rheology which includes blood and plasma viscosity is important in the investigation of some vascular disorders. Haemo-rheology is therefore defined as the study of blood flow in blood vasculatures, taking note of the behavior of red blood cells,  their interaction among themselves and also with the endothelial cells of the vascular wall [3]. Haemo-rheology is the study of flow properties of blood and its elements of plasma and cells. Proper tissue perfusion can occur only when the blood’s rheological properties are within certain levels [4].It includes the examination of visible blood properties by the use of rheometric experiments (such as packed cell volume  (PCV)  and erythrocyte aggregation,  plasma (PCV), erythrocyte sedimentation rate (ESR), haemoglobin concentration (Hb) and fibrinogen level of individuals having different haemoglobin genotypes in Rumuche community, Emohua Local Government Area (LGA), Rivers state. The knowledge gain in blood viscosity can be used as a diagnostic tool for the prediction of some diseases such as thrombotic disorders, cardiovascular diseases, atherosclerosis or haemorrhagic disorders, based on the individual’s haemoglobin genotype.

MATERIALS AND METHODS

2.1 Study Design

This is a cross sectional and comparative study which was aimed at evaluating variability in haemorheological parameters of individuals having haemoglobin genotypic differences in Rumuche community, Emohua Local Government Area of Rivers state of Nigeria. A total of eighty-seven subjects were recruited and blood samples were collected and analyzed.

2.2 Study Area

Rumuche is one of the communities of Emohua Local Government Area of Rivers State. Southern Nigeria. Rumuche is located in Nigeria about 470km south of Abuja, the country’s capital town. The Port Harcourt International Airport is about 19km northeast from the community. The community has an estimated population of about 5,000 persons as at 2016. The climate in Rumuche is usually rainy and dry seasons. Rumuche is situated at Latitude 4052’31”N and Longitude 6051’39”E. The indigenes of Rumuche are majorly farmers. The analyses were carried out at the Haematology Laboratory, Medical Laboratory Science Department, Rivers State University, Port Harcourt, Rivers State University Teaching Hospital, Port Harcourt, De-Integrated Medical Diagnostics and Research Laboratory, Ada-George, Port Harcourt and Professor Nimi Briggs Hospital, Rivers State University, Port Harcourt.

2.3 Study Population

A total of 87 subjects (32 males and 55 females) within the age range of 20-90 years were recruited randomly with a total of 69 subjects having AA genotype and 18 subjects having AS genotype. Non indigenes of Rumuche were excluded from the study and those who present signs and symptoms of illness were also excluded from the study. Only apparently healthy subjects were recruited for the study.

2.4 Collection of Blood Samples and Storage

5mL of venous blood was drawn from each subject and 3mL of blood was dispensed into labelled Tripotassium Ethylene Diamine Tetraacetic Acid (K3EDTA) anticoagulated bottle (at concentration of 1.2mg/ml) for haematological analysis while 2mL was dispensed into labelled plain bottles for fibrinogen estimation. Samples were kept in a box and transported to the laboratory at room temperature. The K3EDTA samples were analyzed within 6 hours of collection while the plain bottle samples were spun at 3000rpm for 5 minutes to obtain serum and stored at – 200C until the analysis was done.

2.5 Methodology

2.5.1 Determination of Haemoglobin Genotype

Method: Cellulose acetate method as described by Wild and Bain [8].

Principle: Haemoglobin is a negatively charged protein which when subjected to electrophoresis, migrates toward the anode. Different haemoglobin variants have different migration rates. Due to structural variation in haemoglobin molecules, they possess different electrical charges and therefore separate into different variants during electrophoresis.

Procedure: The cellulose acetate membrane was prepared and 100ml of the Tris-EDTA-borate buffer was poured into the outer sections of the electrophoresis chamber. Two wicks were made wet in the buffer and draped over each support bridge avoiding air bubbles under the wick. The chamber was covered to prevent evaporation. 5 μL of each haemosylate sample was transferred into the well plate. Cellulose acetate membrane was placed in the Zip-Zone aligning plate and samples were applied using the applicator stick. The cellulose acetate membrane was immediately placed in the electrophoresis chamber with the cellulose acetate side down. The chamber was connected to power supply and electrophoresed for 20 minutes at 350 volts and 50 mA.

2.5.2 Determination of Packed Cell Volume

Method: Microhaematocrit method as described by Cheesbrough [9].

Principle: When anticoagulated whole blood is centrifuged in the microhaematocrit centrifuge at 12,000g for 5 minutes, the blood separates into three layers known as the plasma, buffy coat and red cells. The red cells occupy the lower part of the tube and the volume occupied is known as a percentage of the whole blood. This is measured in percentage (%) or litre/litre (L/L).

Procedure: Capillary tubes were filled by capillary action with whole blood up to three-quarter volume. The tubes were properly sealed with a plasticine at one end. The tubes were carefully placed in the numbered slots of the micro-haematocrit rotor with the sealed end against the rim gasket to prevent breakage. The inner lid was scrapped and then the top lid was covered. The samples were centrifuged for 5 minutes at 12,000g. The packed cell volume was read from the micro-haematocrit reader on the zero line and the top of the column on the 100 line and recorded in percentage.

2.5.3 Determination of Haemoglobin Concentration

Method: Cyanmethaemoglobin method as described by Ochei and Kolhatkar [10].

Principle: Haemoglobin is treated with a reagent containing potassium ferricyanide, potassium cyanide and potassium dihydrogen phosphate. The ferricyanide forms m e t h a e m o g l o b i n w h i c h i s c o n v e r t e d t o cyanmethaemoglobin by the cyanide. All forms of haemoglobin except sulfhaemoglobin are converted to cyanmethaemoglobin.

Procedure: 0.02ml of blood was added to 5ml of Cyanmethaemoglobin reagent (Drabkin’s solution) in a test tube (1:250 dilution). The tube was well mixed and allowed to stand for 10 minutes. Absorbance (A) was read in the spectrophotometer at 540nm, while zeroing the spectrophotometer with the blank (Drabkin’s solution).

Calculation of Results

Absorbance of Standard
Concentration of Test = x Concentration of Standard
Absorbance of Test

Results were recorded in g/dL.

2.5.4 Determination of Erythrocyte Sedimentation

Rate

Method: Westergren method as described by Osei-Bimpong and Burthem [11].

Principle:

When citrated blood in a vertically positioned Westergren tube is left undisturbed, red cells aggregate, stack together to form rouleaux and sediment through the plasma.

Procedure:

0.4ml (1 part) of sodium citrate was added into a Westergren bucket and 1.6ml (4 parts) of well mixed whole blood was added directly into the bucket. A Westergren tube of 200mm was inserted into bucket with the diluted blood drawn up to the zero mark and mixed properly. The tube was vertically placed on the stand, away from direct sunlight and left undisturbed and free from vibrations for 1 hour. The result was read in mm/hr after 1 hour.

2.5.5 Determination of Fibrinogen Concentration Method: Sandwich enzyme-linked immunosorbent assay (ELISA) method. Using Fibrinogen Elisa Kit, Elabscience Biotech Co., Ltd, China. Lot No PHLR6HT9ME; Expiry Date: 2020/07/11

Principle:

This ELISA kit uses the Sandwich-ELISA principle. The micro ELISA plate provided in this kit has been pre-coated with an antibody specific to Human fibrinogen. Standards or samples are added to the micro ELISA plate wells and combined with the specific antibody. Then a biotinylated detection antibody specific for Human fibrinogen and Avidin-Horseradish Peroxidase (HRP) conjugate are added successively to each micro plate well and incubated. Free components are washed away. The substrate solution is added to each well. Only those wells that contain Human fibrinogen, biotinylated detection antibody and Avidin-

HRP conjugate will appear blue in color. The enzyme-substrate reaction is terminated by the addition of stop solution and the color turns yellow. The optical density (OD) is measured spectrophotometrically at a wavelength of 450 nm ± 2 nm. The OD value is proportional to the concentration of Human fibrinogen. You can calculate the concentration of Human fibrinogen in the samples by comparing the OD of the samples to the standard curve.

Procedure:

Standard working solution was added to the first two columns: Each concentration of the solution was added in duplicate, to one well each, side by side (100 uL for each well). Samples were added to the other wells (100 uL for each well). The plate was covered with the sealer provided in the kit and incubated for 90 min at 370C. Note: Solutions were added to the bottom of the micro ELISA plate well, touching of the inside wall was avoided. The liquid was then removed out of each well. Washing was avoided. 100 μL of Biotinylated Detection Antibody working solution was immediately added to each well and covered with the Plate sealer. It was gently mixed and incubated for 1 hour at 37°C. The solution was decanted from each well, and 350 uL of wash buffer was added to each well and soaked for 1-2 min and the solution was decanted from each well and patted dry against clean absorbent paper. The wash step was repeated 3 times. 100 μL of HRP Conjugate working solution was added to each well and covered with the Plate sealer. It was incubated for 30 min at 37°C. The solution was decanted from each well and the wash process was repeated for five times. 90 μL of Substrate reagent was added to each well and covered with a new plate sealer. This was incubated for about 15 min at 37°C. The plate was protected from light. 50 μL of Stop Solution was added to each well. The optical density (OD value) of each well was determined at once with a micro-plate reader set to 450 nm. Calculation of results was performed using Beer-Lambert’s law.

Absorbance of Test

Conc.of Test = x Conc.of Standards nearest to test

Absorbance of Standards

2.6 Statistical Analysis

Statistical analysis was done using Graph-pad prism version 8.2.0 for both descriptive and inferential statistics for the different groups under study. The descriptive data was given as mean ± standard deviation (SD).

RESULTS

3.1 Demographic Profile of Participants in the Study population

A total of 87 subjects were recruited for the study between August 4th and August 20th, 2019. Eighteen (20.69%) of the total number were of AS haemoglobin genotype while 69 (79.31%) were of the AA haemoglobin genotype. Table 3.1 shows the demographic profile of the study population.

Table 3.1: Demographic Profile of Participants in the Study Population

Haemoglobin Genotype Study Population
AA 69 (79.31 %)
AS 18 (20.69 %)

Evaluation of Haemo-rheological Variability…

3.2 Comparison of Some Haemo-rheological value of 0.0450. There is a non-significant increase
Parameters Based on Differences in (p>0.05) in the PCV of AA individuals as compared to the
Haemoglobin Genotypes AS individuals with a p-value of 0.1013. A non-significant
increase (p>0.05) in the ESR of AA and AS individuals
From table 3.2, there is a significant increase (p<0.05) in with a P-value of 0.0649. A non-significant increase
the haemoglobin concentration of AA genotype (p>0.05) in the fibrinogen level of AS individuals as
individuals as compared to the AS individuals with a p- compared to AA individuals.

Table 3.2: Comparison of Some Haemo-rheological Parameters Based on Differences in Haemoglobin Genotypes

Parameters AA AS p-value Inference
Mean ± SD Mean ± SD
Haemoglobin (g/dl) 14.68 ± 2.600 12.76 ± 2.931 0.0450 S
PCV (%) 37.78 ± 4.466 35.11 ± 5.016 0.1013 NS
ESR (mm/hr) 23.94 ± 21.16 37.00 ± 19.88 0.0649 NS
Fibrinogen (ng/ml) 474.9±190.1 499.4±199.6 0.7086 NS

3.3 Comparison of Some Haemo-rheological

Parameters in Males Based on Differences in Haemoglobin Genotypes

From table 3.3, there is a non-significant increase (p>0.05) in the Hb of AA male individuals as compared to AS male individuals with a p-value of 0.7219. A non-significant increase (p>0.05) in the PCV of AA male individuals as compared to the AS male individuals wth a p-value of 0.7524. A non-significant increase (p>0.05) in the ESR of AS male individuals as compared to the AA male individuals with a p-value of 0.6068. A non-significant increase (p>0.05) in the fibrinogen level of AA males as compared to AS males with a p-value of 0.4450.

Table 3.3: Comparison of Some Haemo-rheological Parameters in Males Based on Differences in Haemoglobin Genotypes

Parameters AA AS p-value Inference
Mean ± SD Mean ± SD
Haemoglobin (g/dl) 14.13 ± 2.605 12.14 ± 3.048 0.0858 NS
PCV (%) 37.46 ± 4.294 34.31 ± 4.535 0.0811 NS
ESR (mm/hr) 26.54 ± 21.94 37.62 ± 23.33 0.2244 NS
Fibrinogen (ng/ml) 460.0 ± 174.0 495.2 ± 205.6 0.6420 NS

Key: S=Significant; NS=Non Significant; PCV= Packed Cell Volume; ESR=Erythrocyte Sedimentation Rate; Mean ± SD= Mean ± Standard Deviation. Note: The abbreviations are applicable to all tables

DISCUSSION

The normal haemoglobin usually found in adult humans is Hb A, although some other forms occur as a result of point mutation in the globin chains responsible for this formation. These include the Hb S, Hb C, Hb D, amongst many others. Haemoglobin genotypes are inherited characters determined by the different combinations of amino acid sequence found on the globin polypeptide chains. They include HbAA, HbAS, HbAC, HbSS, HbSC amongst others. Haemorheological tests are a group of tests used majorly to determine the blood rheological status of an individual. In course of this research work, two haemoglobin genotypes were considered, which are AA and AS genotypes [7, 12].

Haemoglobins found in the red blood cells are intracellular proteins which help in the transportation of oxygen from the lungs to the tissues. From the results obtained, haemoglobin concentration for Hb AA genotype 14.68 ± 2.600 was found to be significantly increased by p<0.05 when compared to that of the Hb AS genotype 12.76 ± 2.931. This result is in accordance with the study of Obeagu et al., [13] and the significant difference is as a result of Hb S seen in the Hb AS genotype which causes occlusion in blood vessels thereby reducing the oxygen carrying capacity of the blood and the circulating red blood cells due to their destruction by the spleen. The mean level of haemoglobin concentration in male subjects for AA genotype was 14.96 ± 2.876 g/dL while that of AS was 14.38 ± 2.024 g/dL. The mean level for AA females was found to be 14.13 ± 2.605 g/dL while that of AS was 12.14 3.048 g/dL. The values of haemoglobin concentration for haemoglobin genotype AA was within the normal reference values according to World Health Organization which is 13.0-18.0g/dL for males and 12.5-16.0g/dL for females which confirms the works of Bakare et al. [14] and Obeagu et al. [13] that a significant difference occurs when haemoglobin genotype AA is compared with AS.

The major determinant of blood viscosity is the packed cell volume and an increase in packed cell volume causes increase in blood viscosity. Also, reduction in packed cell volume will lead to reduction in the blood viscosity. Packed cell volume for both haemoglobin genotypes had mean values of 37.78 ± 4.466 % for Hb AA genotype and 35.11 ± 5.016 % for Hb AS genotype. There was a non-significant difference of p>0.05 seen and when both genotypes were compared. Also, when genders (males and females) of both genotypes were compared, the mean value was found to be 38.40 ± 5.459 % for AA genotype and 37.20 ± 6.140 % for AS genotype males, while the females had 37.46 ± 4.294 % for AA genotype and 34.31 ± 4.535 % for AS genotype. There was also no significant difference seen which contradicts the work of Obeagu et al, [13] that due to the destruction of sickle shaped cells before the normal life span of 120 days elapses in AS individuals.

There was a non-significant difference of p>0.05 in the comparison of the erythrocyte sedimentation rate of haemoglobin genotypes AA and AS individuals. Based on this, being AA or AS does not invariably affect erythrocyte sedimentation rate in apparently healthy individuals. Fibrinogen level for both haemoglobin genotypes indicated that there was a non-significant difference and when genders of both genotypes were compared, there was also no significant difference which was in accordance with the work of Ajayi and Uche [13] that there is no significant increase in the fibrinogen level of AA and AS genotypes.

CONCLUSION

From the study, haemoglobin concentration was significantly higher in AA individuals than in AS individuals. Packed cell volume showed no significant variation; erythrocyte sedimentation rate showed no significant variation due to the absence of sickle cell disease, inflammatory disease, infections, amongst other disease conditions. Also, fibrinogen level showed no significant variation because the clotting factors of these individuals seems normal at the time of the research.

As a result of the significant difference in the haemoglobin concentration, there will be a directly proportional difference in the blood viscosity of the different haemoglobin genotypes and this can be a useful diagnostic tool alongside fibrinogen concentration for predicting the occurrence of some diseases such as atherosclerosis, thrombotic disorders, cardiovascular diseases or haemorrhagic disorders.

LIMITATION OF THE STUDY

The study did not include subjects with haemoglobin SS and/or SC, due to the fact that Sicklers (those with Sickle Cell Anaemia) did not give their consent to be part of the study.

Serekara Gideon Christian

CONSENT

A written consent was obtained from each participant.

ETHICAL APPROVAL

Approval to conduct the research was granted by the Department of Medical Laboratory Science, Rivers State University, Nigeria.

COMPETING INTERESTS

Authors have declared that no competing interests exist.

REFERENCES

  • World postal code (2019). Emohua post codes: Nigeria . Retrieved from https://www. worldpostalcode.com/nigeria/rivers/emohua. Accessed 11th July, 2019.
  • Rumuche in Rivers state, Nigeria. Destination Guide. Retrieved from https://www.tripmondo. com/nigeria/rivers-state/emohua/rumuche. Accessed 28th July, 2019.
  • Robertson A. M., Sequeira A., Kameneva M. V. (2008). Hemorheology. In: Hemodynamical Flows (pp 63-120). Oberwolfach Seminars, vol
    1. Birkhäuser Basel, Switzerland.
  • Cokelet, G. R. & Meiselman, H. J. (2007). Basic aspects of haemorheology, in Baskurt, O. K., Hardeman, M. R., Rumping, M. W. & Meiselman, H. J. (Eds), Handbook of Haemorheology and Haemodynamics (7th ed; pp 21-33). The Netherlands; IOS Press.
  • Ajayi, O. I., Famodu, A. A., Otakpor, A. N. & Idubor, J. F. (2005). Fibrinolytic risk of unmodified electroconvulsive therapy in Nigeria depressed patients, Haema, 8(3), 436-438.
  • Hardisson, R. C. (2012). Evolution of haemoglobin and its genes, Cold Spring Habour Perspectives in Medicine, 2(12), 1-18.
  • Buseri, F. I. & Okonkwo, C. (2014). Abnormal haemoglobin genotypes and rhesus blood groups associated with HIV infection among HIV – exposed infants in North-Western Nigeria, Dove Medical Press, 2014(6), 15-20.
  • Wild, B. J. & Bain, B. J. (2012). Investigation of abnormal haemoglobins and thalassemia, in Bain, B. J., Bates, I., Laffan, M. A. & Lewis, S. M. (Eds), Dacie and Lewis practical haematology (11th ed; pp. 301-332). United Kingdom; Churchill Livingstone.
  • Cheesbrough, M. (2006). Haematological tests, in Cheesbrough, M. (Ed), District Laboratory Practice in Tropical Countries (2nd ed; pp 268-347). New York, Cambridge University Press.
  • Ochei, J. O. & Kolhatkar, A. A. (2007). The complete blood count, in Ochei, J. O. & Kolhatkar, A. A. (Eds), Medical Laboratory Science Theory and Practice (pp. 273-287). United Kingdom, McGraw-Hill publishing company limited.
  • Osei-Bimpong, A. & Burthem, J. (2012). Supplementary techniques including blood parasites diagnosis, in Bain, B. J., Bates, I., Laffan, M. A. & Lewis, S. M. (Eds), Dacie and Lewis Practical Haematology (11th ed; pp 101-121). United Kingdom; Churchill Livingstone.
  • Akhigbe, R. E., Ige, S. F., Afolabi, A. O., Azeez, O. M., Adegunlola, G. J. & Bamidele, J. O. (2009). Prevalence of haemoglobin variants, ABO and rhesus blood groups in Ladoke Akintola University of Technology, Ogbomoso, Nigeria, Trends in Medical Research, 4(2), 24-29.
  • Obeagu, E. I., Okoroiwu, I. L., Daniel-Igwe, G. & Elemchukwu, Q. (2015). Comparison of some haematological profiles in genotype AA, AS and AC persons amongst Imo State University students, International Journal of Advanced Multidisciplinary Research, 2(12), 23-28.
  • Bakare, A. A., Azeez, M. A. & Agboiade, J. O. (1997). Gene frequencies of ABO and Rhesus blood groups and haemoglobin variants in Ogbomoso, south-west, Nigeria, Global Journal of Medical Science, 3(3), 17-22.